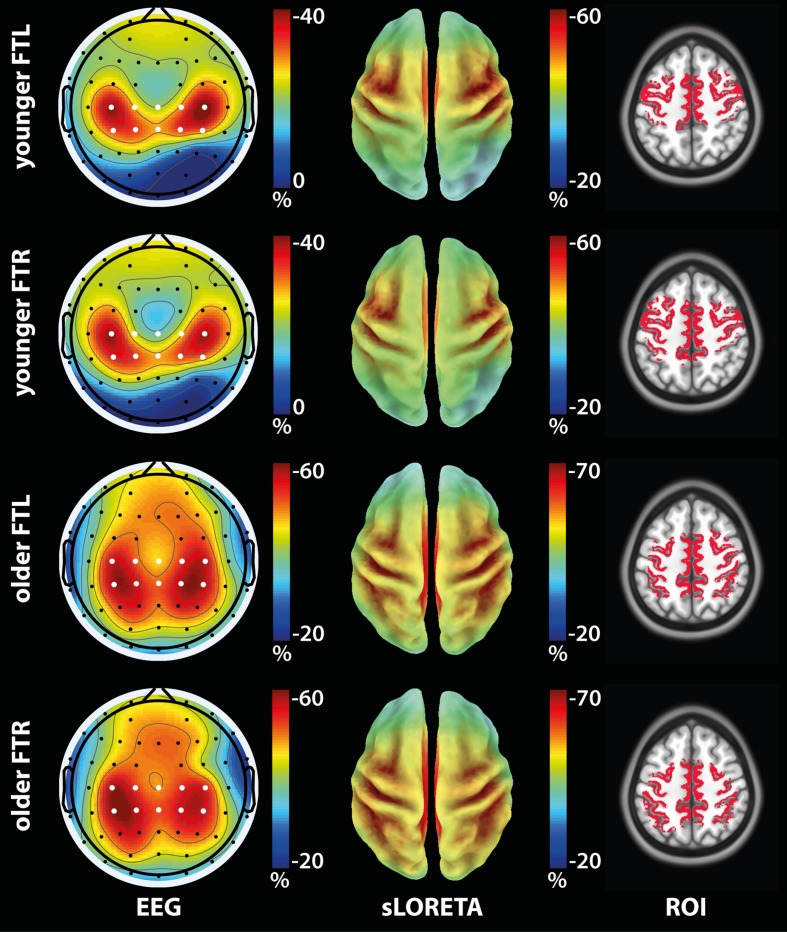
FIGURE 2.
Activation ROI definition from ERD maps in the α/β band (7.5–25 Hz) for the older and younger groups for the FTL and FTL conditions. (Left): Group-average ERD topographic maps. White dots: Electrodes used in the ERD computation. (Center): Group-average sLORETA modulation maps. (Right): Activation ROIs shown on the anatomical template.

