Figure 4.
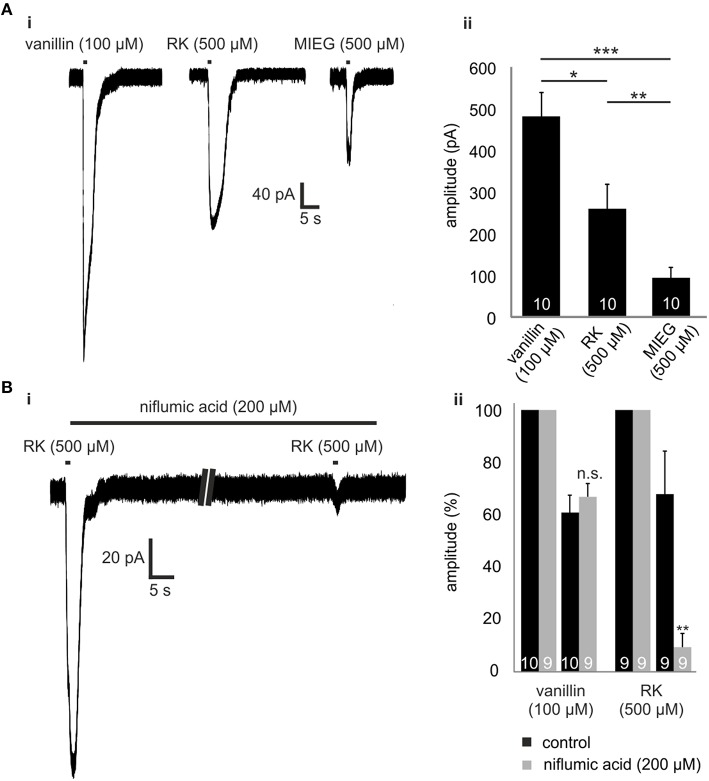
Raspberry Ketone. (Ai) Comparison of the odor-elicited currents of vanillin (100 μM), MIEG (500 μM), and Raspberry Ketone (500 μM). (Aii) Bar diagram showing the mean amplitudes elicited by these odors when applied for 1 s. (Bi) Patch clamp experiments using low extracellular Ca2+ + NMDG conditions. After the primary application of RK, the sample was incubated for 1 min with niflumic acid before RK was applied again. (Bii) Amplitudes of the elicited currents were normalized to the first control signal and compared to control measurements without niflumic acid incubation.

