Figure 2.

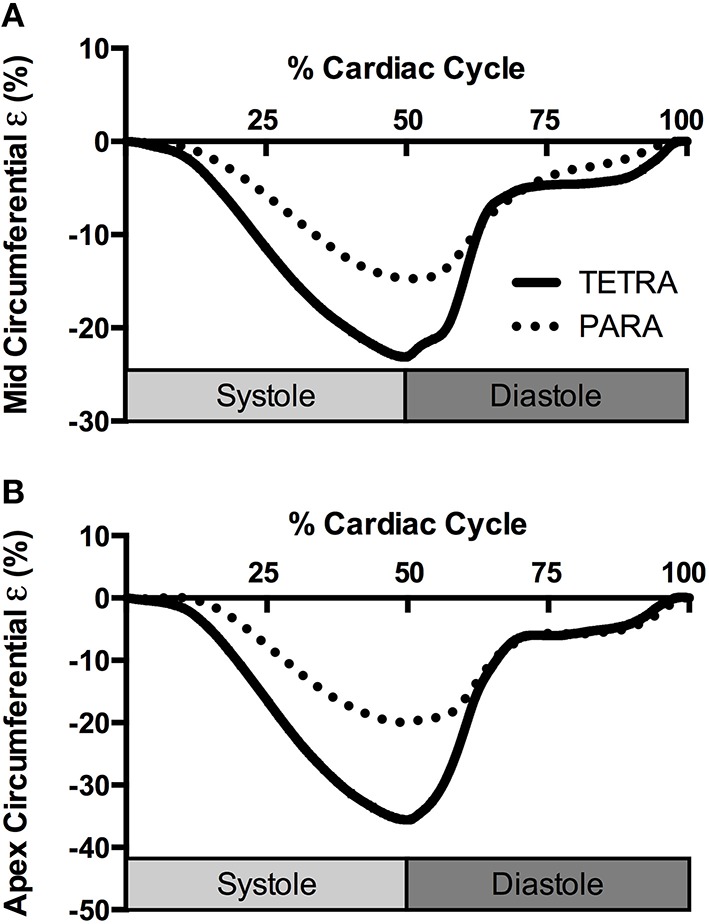
Group averaged circumferential strain (ε) traces at the level of the papillary muscle (A) and apex (B) for TETRA (solid line) and PARA (dotted line), normalized to percentage of the cardiac cycle.

Group averaged circumferential strain (ε) traces at the level of the papillary muscle (A) and apex (B) for TETRA (solid line) and PARA (dotted line), normalized to percentage of the cardiac cycle.