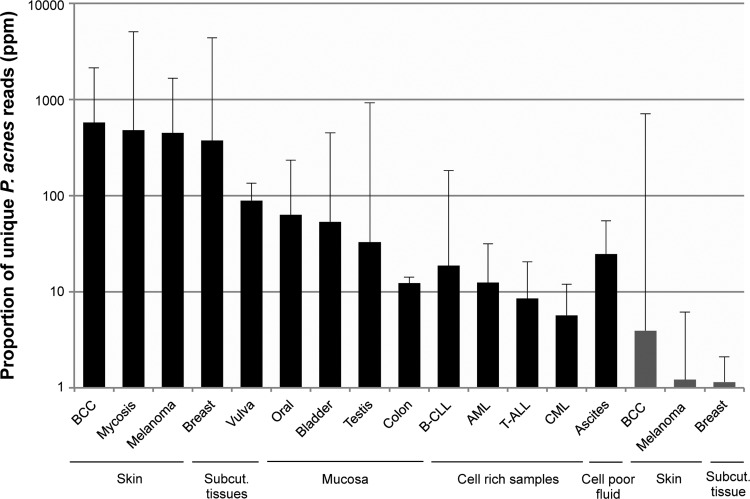
FIG 1.
Relative P. acnes levels in enriched (black bars) and shotgun-sequenced (gray bars) samples having a median P. acnes proportion of >1 ppm. The proportions of unique P. acnes reads (in parts per million) organized according to tissue type are shown on a logarithmic scale. The error bars indicate 1 standard deviation. BCC, basal cell carcinoma; Subcut., subcutaneous.

