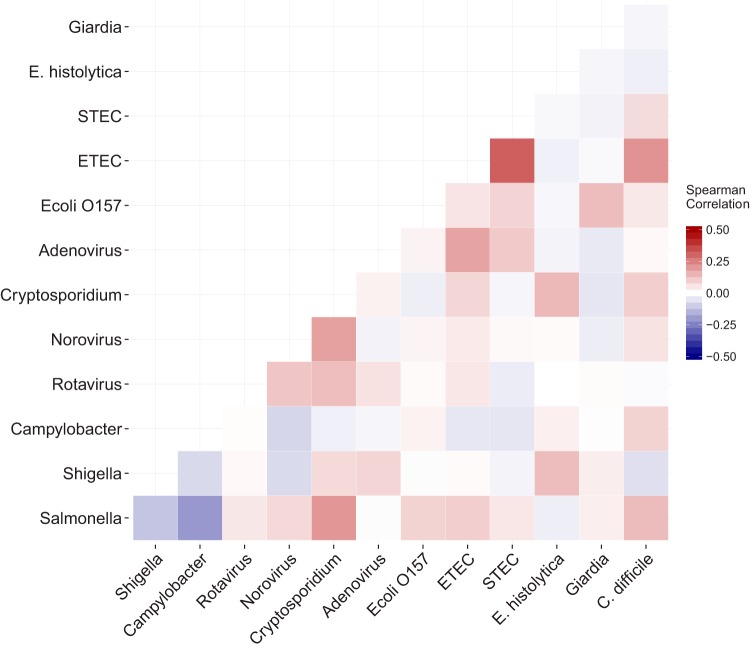
FIG 2.
Correlation matrix of coinfections from 479 diarrheal stool samples. Common pathogens detected with the Luminex xTAG gastrointestinal pathogen panel are listed in a matrix format along the x and y axes. The color within each square represents the Spearman correlation coefficient for each pairwise coinfection. The darker the red, the more positive the correlation, and the darker the blue, the more negative the correlation. Note that the range of the color scale spans −0.5 to 0.5.

