Figure 3.
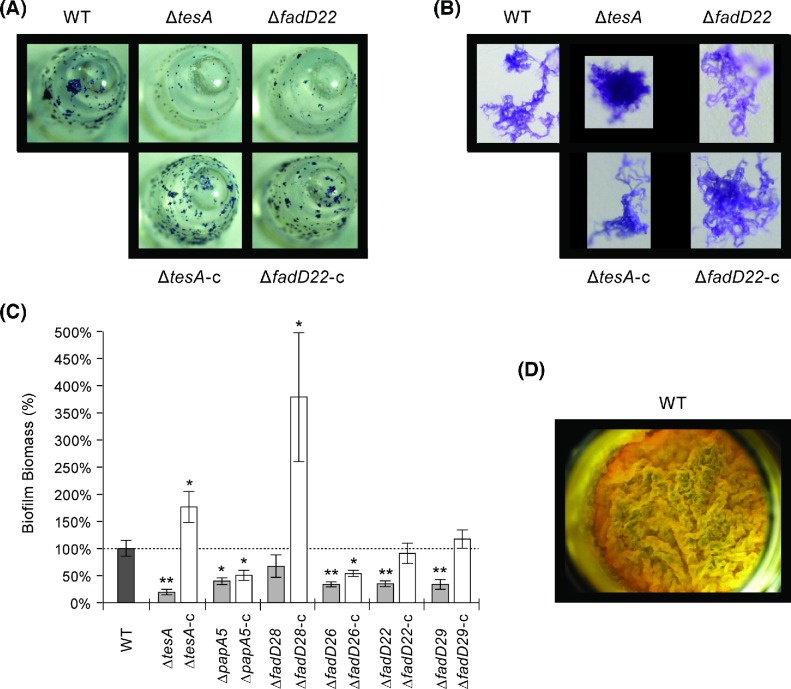
Biofilm formation by M. marinum strains. Representative peg (A) and biofilm microcolony (B) images of the WT, two mutants (one PDIM− PGL− and one PDIM+ PGL−), and corresponding genetically complemented strains are shown. The results with these mutants are comparable to those seen with the rest of the mutants. Biofilm formation on the pegs was quantified using a standard colorimetric method (C). The results represent means and SEM of a minimum of six independent experiments. Student's t-test p values versus WT: *, <0.05; **, <0.01. All strains formed comparable pellicles on the surface of the liquid growth medium (D). The representative pellicle shown is for the WT.

