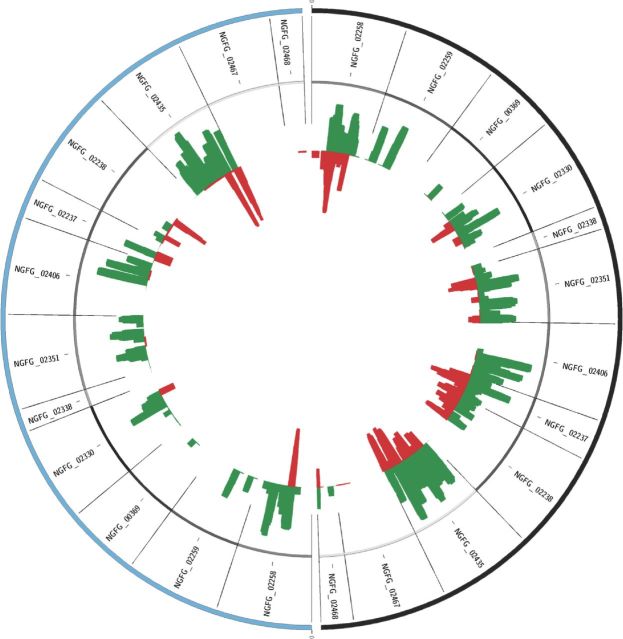
Figure 3.
sRNAs mapping to opa. The quantity of sRNAs mapping to the annotated opa genes of N. gonorrhoeae strain MS11 are shown as histograms inset to the genes. The wild-type genes are shown in black to the right while the genes from the rppH mutant are shown in blue to the left. sRNAs that map sense to the opa genes are shown in green, while sRNAs that map anti-sense to the opa genes are shown in red.

