FIGURE 3.

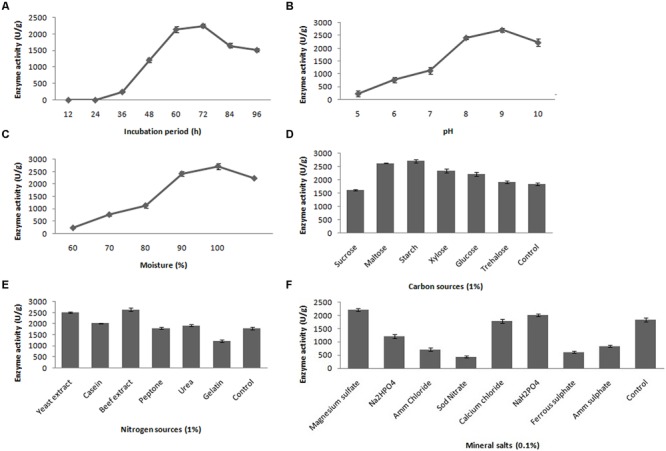
Effect of incubation time (A), pH (B), moisture (C), carbon source (D), nitrogen source (E) and mineral salts (F) on fibrinolytic enzyme production. Error bar represents standard deviation.

Effect of incubation time (A), pH (B), moisture (C), carbon source (D), nitrogen source (E) and mineral salts (F) on fibrinolytic enzyme production. Error bar represents standard deviation.