
Fig 1.
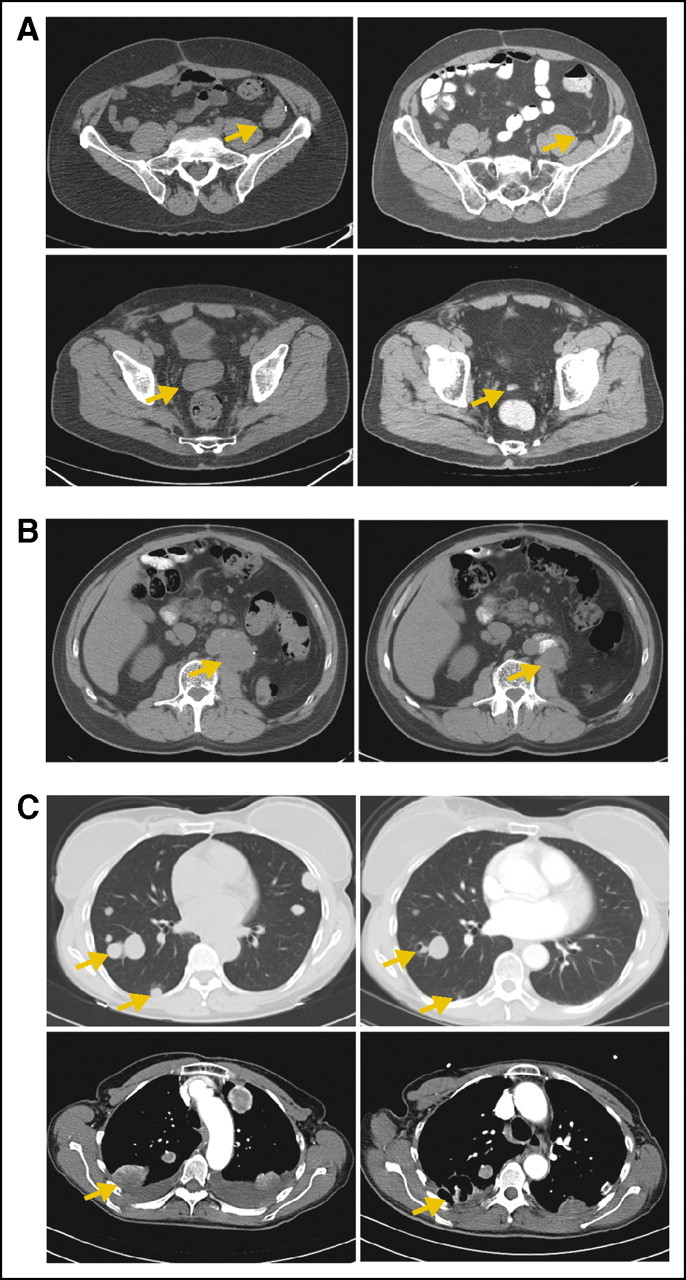
Computed tomography images of perivascular epithelioid cell tumors (PEComas; left panels) at baseline and (right panels) after treatment with sirolimus. All images are chosen to show the maximal size of the lesions indicated by arrows; other lesions may be out of phase in the two studies. (A) Retroperitoneal PEComa before and after 1 year of treatment. (B) Renal PEComa before and after 9 months of treatment. (C, top) Metastatic uterine PEComa in lung before and after 6 weeks of treatment; some lesions are improved, whereas others remain stable. (C, bottom, left) Before and (right) 3 weeks after treatment with sorafenib.