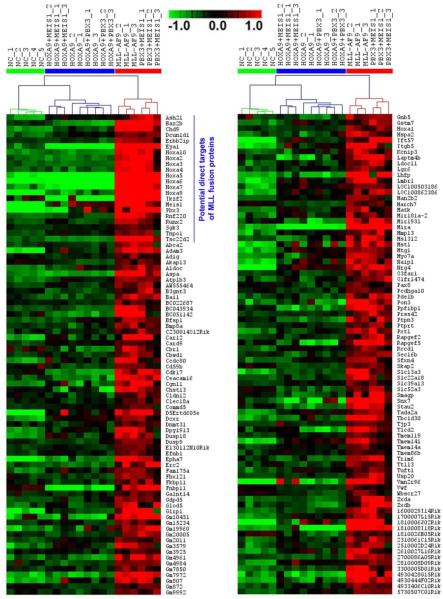
Figure 4. Heatmap of expression profiles of the 116 genes that are expressed at a significantly higher level in Group 3 (i.e., PBX3+MEIS1 and MLL-AF9 samples) than in both Groups 1 and 2.
Of them, 22 genes are potential direct target genes of MLL-fusion proteins. Expression data was mean centered. Red represents a high expression (scale shown in the upper middle).

