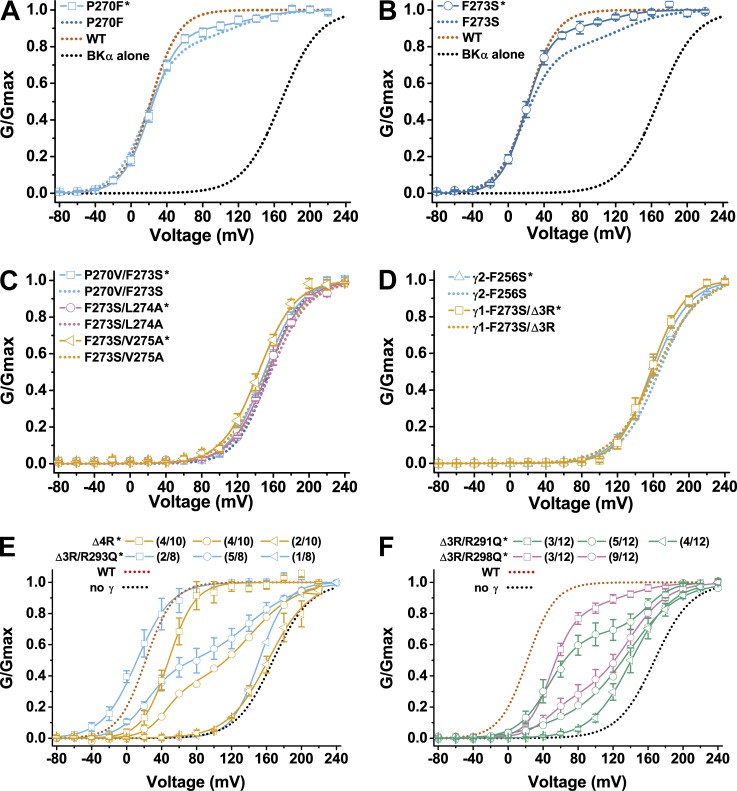
Figure 6.
Effects of protein overexpression on the modulatory function of selected γ1 mutants. (A–F) Voltage dependence of BK channel activation in the presence of selected BKγ1 mutants with mutations in the TM segment (A–D) and poly-Arg cluster region (E and F). Overexpressed mutants are indicated with asterisks on the right side of their names. For comparison, the voltage dependence of BK channel activation in the absence or presence of the non-overexpressed γ1 wild type or mutants are included as dotted lines. As in Fig. 4, membrane patches with similar channel G-V relationship (E and F) were grouped together and indicated in the label with the number of grouped membrane patches over total recorded membrane patches. Error bars represent ±SEM.

