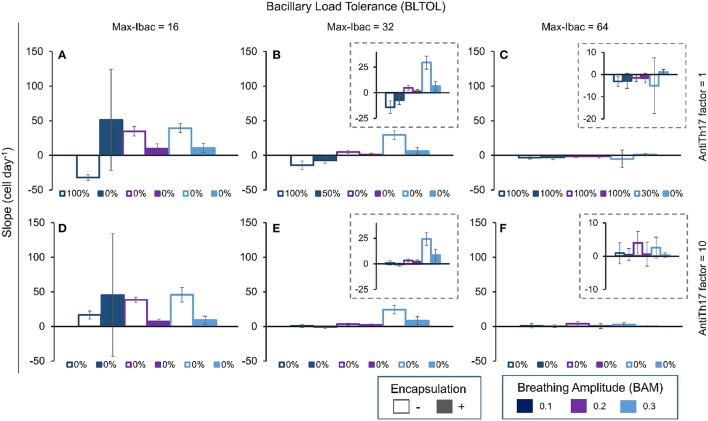
Figure 12.
Influence of different parameters on the slope of aAM evolution at day 42. Maximum bacillary load per macrophage (BLTOL): 16 (A,D), 32 (B,E), 64 (C,F). AntiTh17 factor: 1 (A–C), 10 (D–F) Encapsulation factor: −, no encapsulation, +, encapsulation. Breathing amplitude (BAM): 0.1, 0.2, 0.3. Bars indicate the mean of 10 runs. Individual legends indicate the percentage of 10 runs in which the PMN population exceeded the aAM population.

