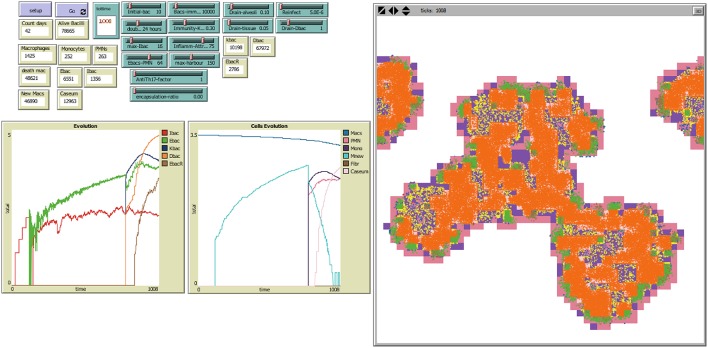
Figure 2.
NetLogo's user interface, with model TBPATCH. Green sliders are the parameters that can be changed by the user. Brown boxes show the evolution of different variables during a simulation. The left window is the world representation, where spatial evolution of the infection can be seen. Colors: Alveoli: White: when a single AM is present; Black: when the AM is destroyed; Blue: when the AM is destroyed and replaced by another AM from the interstitium; Violet: when an activated AM (aAM) is present; Pink: when PMNs occupy the alveoli; Brown: capsule. Bacilli: Blue challenge bacilli; Red: Intracellular bacilli (Ibac); Green: Extracellular (Ebac); Brown: growing Ebac; Orange: dormant (Dbac); Yellow: killed bacilli (Kbac).

