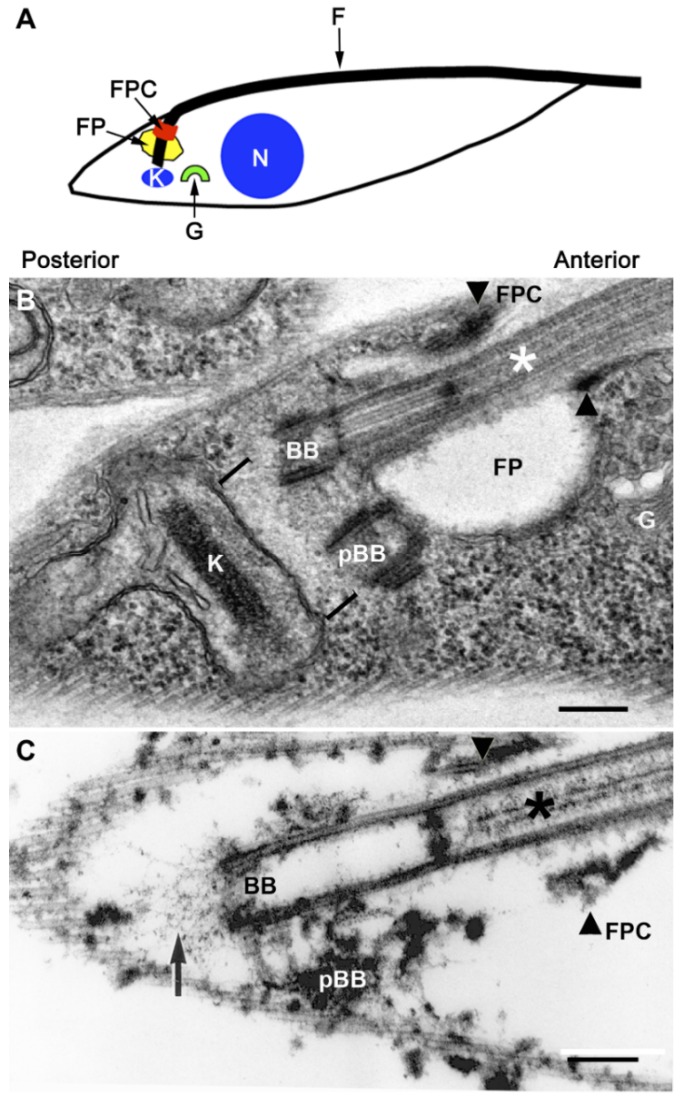
Figure 1.
Schematic diagram of a T. brucei procyclic cell, showing cell polarity and organelle location. (A) The schematic shows the anterior and posterior regions of the cell. Note the polarization of organelles and structures to the cell posterior including the flagellar pocket (FP), flagellar pocket collar (FPC), Kinetoplast (K) and Golgi apparatus (G). (N), indicates the nucleus and (F) the flagellum. Figure 1A is reproduced from [44]; (B) Transmission electron micrograph of a thin section through the FP of a T. brucei procyclic cell. The asterisk indicates the axoneme. The mature basal body is denoted by BB. The immature basal body is denoted by pBB, and in this case it may have started maturing and has docked with the FP. The square brackets denote the ribosome free region. The kinetoplast (K) is the mitochondrial genome. The flagellar pocket is denoted by FP and the FPC is marked by arrowheads. The Golgi apparatus is denoted by G. The FPC forms the adherens-like junction containing BILBO1; (C) A thin section transmission electron micrograph similar to (A), but from a T. brucei procyclic “cytoskeleton”, where the soluble cell contents and membranes have been extracted with non-ionic detergent. The labels are the same as in (B) except the addition of the black arrow, which indicates the exclusion zone filaments of the tripartite attachment complex (TAC) [45]. Scale bars: 250 nm.

