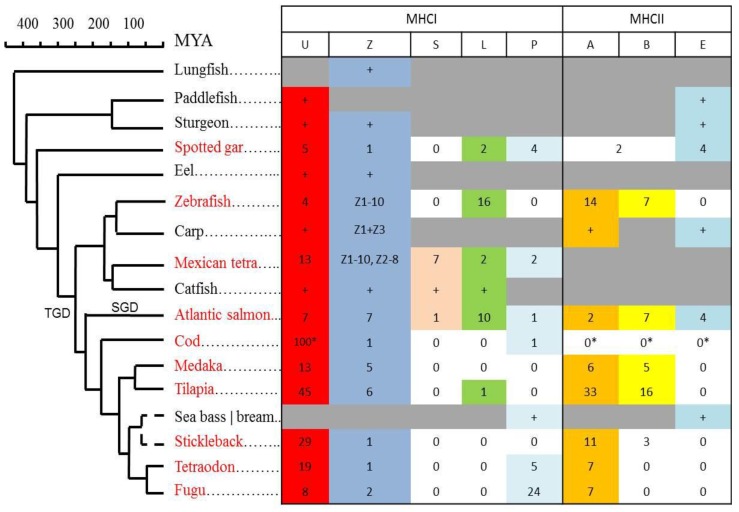
Figure 7.
Phylogenetic distributions and gene count for MHC class I and class II lineages. Presence of MHCI (U,Z,S,L,P; data from [19]) and MHCII (A,B,E; data from [18]) lineages are shown in a tabular format linked to the phylogeny of each individual species. Species with sequenced genomes that have been studied in detail are shown using red font. Number of genes within each lineage are shown, where the “+” refers to at least one sequence identified in species without sequenced genomes. Presence of a lineage is marked using individual colors. Lineages not identified are shown using white cells labelled 0, where the MHCII data for cod originates from Star et al.(* [33]). Lineages we have not looked for or there is insufficient data to conclude are shown using grey cells. Number of Z1–Z3 lineage genes are shown for zebrafish and Mexican tetra, but unknown for carp, lacking sequenced genomes. For spotted gar, two MHCII sequences could not be assigned as A or B and are thus shown as A/B [18]. The P lineage was found in sea bass, while the E lineage was found in sea bream.

