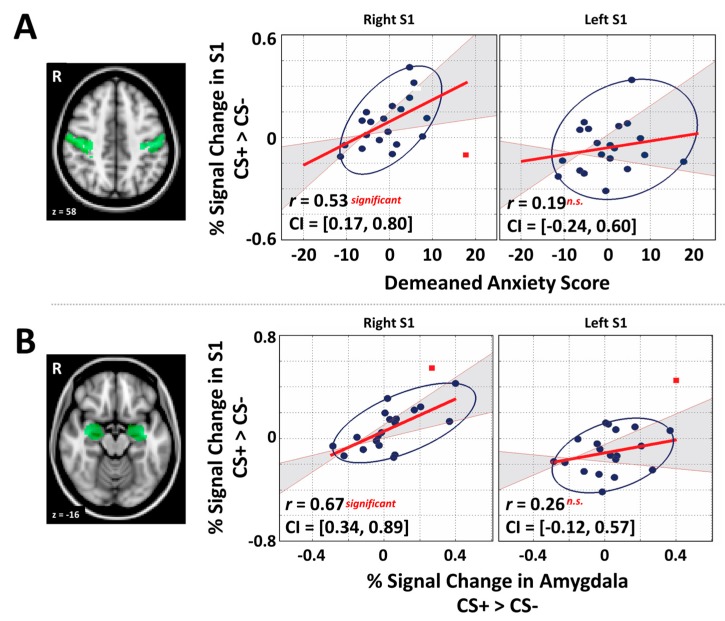
Figure 2.
(A) The anatomical structural masks of S1 used in this study and scatter plots illustrating the correlation between individual trait anxiety level and evoked signal in the S1 ROI of the right and left hemispheres, respectively; (B) the anatomical structural masks of amygdala (bilateral) and scatter plots illustrating the correlation between evoked signal in the amygdala and the S1 region. Gray-shaded area indicates 95% bootstrapped CIs. Red square data points indicate bivariate outliers that were identified by the robust method [44].

