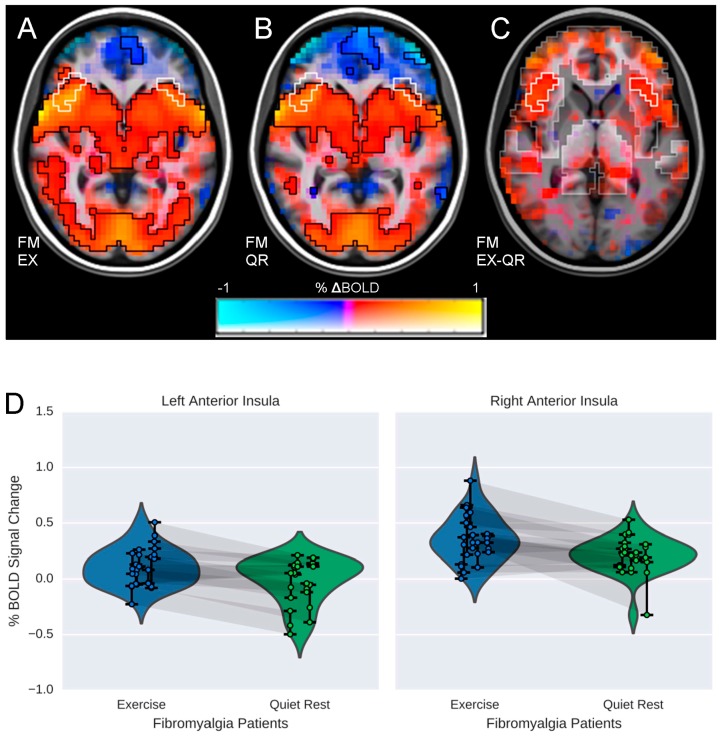
Figure 2.
Maps of BOLD responses to pain in nine FM patients. (A) BOLD response post-exercise (EX); (B) BOLD response post-quiet rest (QR); (C) within group differences in BOLD responses in the bilateral anterior insula (EX-QR). Color represents the β coefficient (% signal change ranging from −1% to 1%) and opacity represents t-statistic, with full opacity at a voxelwise t corresponding to p < 0.01. The significant cluster at α < 0.05 (corresponding to a cluster size threshold of 17 voxels) is outlined in white. Analyses were performed at 4 mm × 4 mm × 4 mm resolution using a mask of regions determined a priori from the hypotheses, which is highlighted in the background of image C; (D) Violin plots illustrating condition differences in %BOLD signal change in the left and right anterior insulae. Each point represents the average %∆BOLD in the cluster during one run, so that each subject is represented by three connected points. Shadows connecting points between violin plots indicate data from the same individual during each condition (EX & QR). Note that the region from which these points are drawn was chosen because there is a significant difference between EX and QR; the plot is intended to help clarify the within-subjects’ results.

