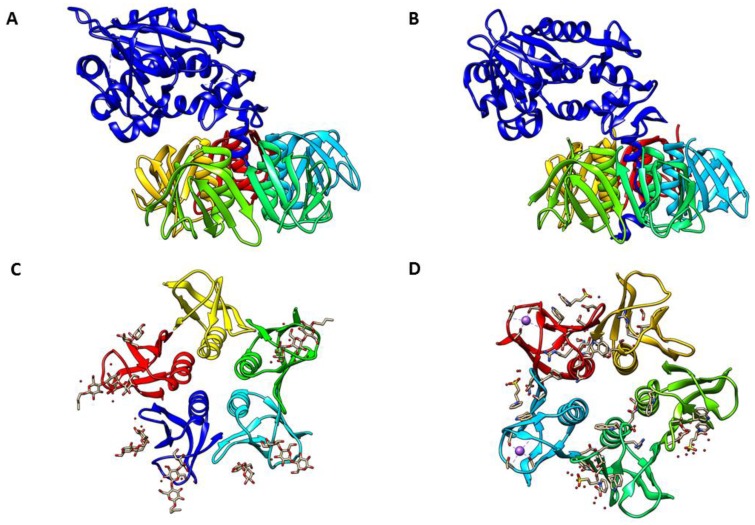
Figure 1.
Crystal structure of Shiga toxin. (A) Shiga toxin type 1 (PDB #1DM0); (B) Shiga toxin type 2 (PDB #1R4P); (C) Shiga toxin 1 B-subunit with Gb3 receptor (PDB #1BOS); (D) Shiga toxin 2 B-subunit with Gb3 receptor (PDB #1R4P, deletion of A-subunit). In (A,B), A-subunits are shown in dark blue, with B-subunits shown in different colors; in (C,D), individual B-subunits are shown in different colors. PDB files of all structures were obtained from RCSB PDB (Research Collaboratory for Structural Bioinformatics Protein Data Base, www.rcsb.org) and compiled PDB files with Chimera 1.10.2 (UCSF Chimera, www.cgl.ucsf.edu/chimera).

