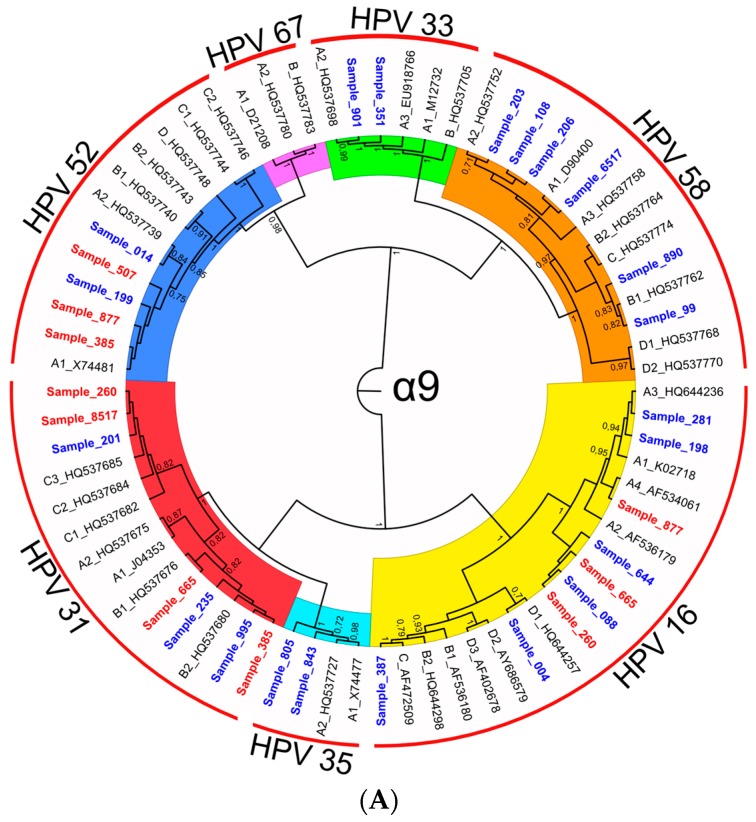
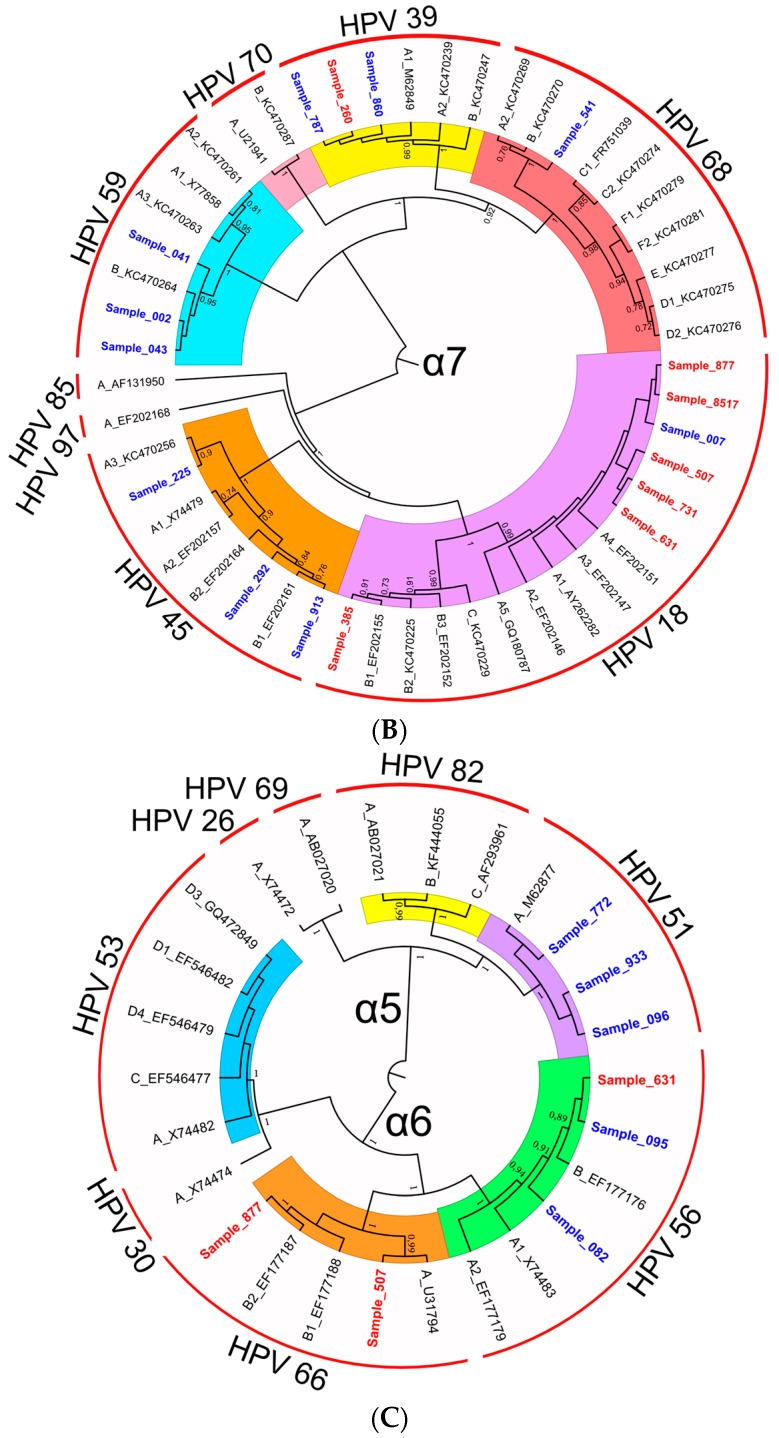
Figure 1.
(A–C) Phylogenetic trees of HPV E6/E7 sequences obtained from clinical samples (red and blue labels for sequences obtained with 454 pyrosequencing and Sanger, respectively) and references (black labels) belonging to the α-9 (A); α-7 (B); α-5 and alpha-6 (C) species inferred by using the Maximum Likelihood method based on the Tamura 3-parameter model [51] (A) and the Hasegawa-Kishino-Yano model [52] (B,C). The percentage of bootstrap replications in which the associated samples clustered together is shown next to the branches (over 1000 iterations). A discrete Gamma distribution was used to model evolutionary rate differences among sites (5 categories: +G, parameter = 0.6006 (A), 1.1395 (B), 1.6034 (C)). Tree branch lengths are proportional to the number of substitutions per site. There were a total of 741, 796, and 695 positions, respectively, in the final dataset of phylogenetic trees (A–C). Evolutionary analyses were conducted in MEGA6 [40] and displayed with FigTree [53]. Sample labels include sample ID; reference sequence labels include the GenBank accession number and the ID of variant lineages/sublineages (variant lineages are designed as A, B, etc.; variant sublineages are designed as A1, A2, etc.).


