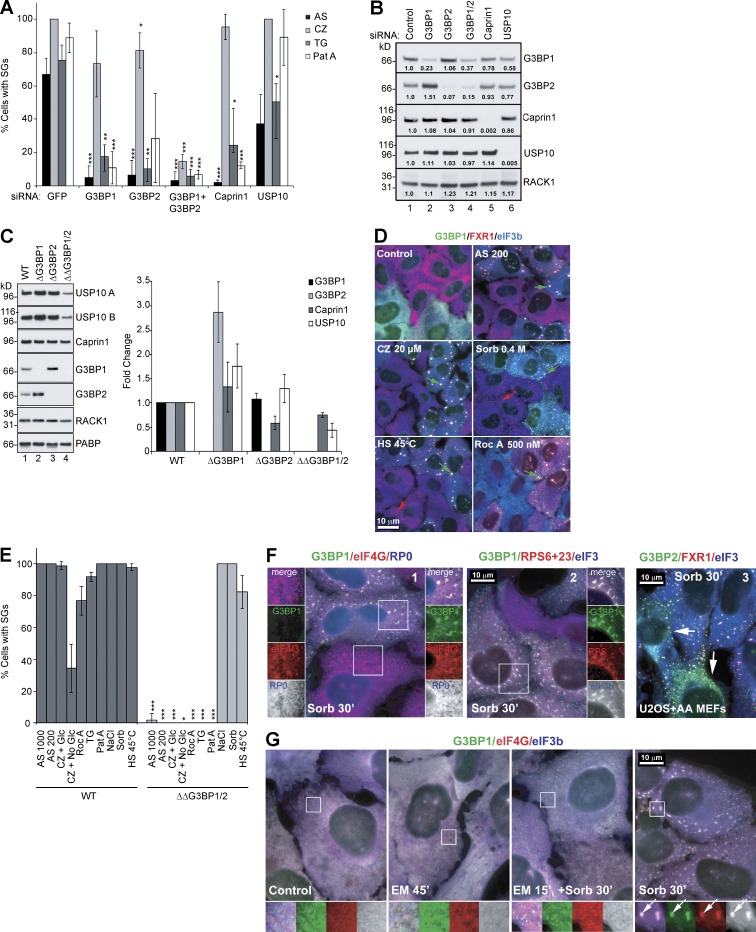
Figure 1.
Role of G3BP and partners in SG assembly. (A) U2OS-WT cells treated with indicated siRNAs were stressed for 1 h with 100 µM AS, 20 µM CZ, 1.0 µM TG, or 50 nM Pat A and then stained for SG markers eIF4G/eIF3b and scored. Data shown are mean ± SEM and are analyzed using the unpaired t test. *, P < 0.05; **, P < 0.01; ***, P < 0.005. siGFP control versus target siRNA treatments, n = 3. (B) Western blot analysis of siRNA-treated U2OS-WT cells. Proteins were quantified from blots using densitometry and normalized to RACK1, n = 3. Fold increase/decrease versus control is indicated. Mr (kD) are shown. (C) Western blot analysis of ΔG3BP1, ΔG3BP2, or ΔΔG3BP1/2 cell lysates, blotted for G3BP1, G3BP2, USP10 (A and B indicate different antibodies), Caprin1, RACK1, and PABP. Mr (kD) are shown. Proteins were quantified from blots using densitometry and normalized to RACK1. Fold change of WT versus KO was plotted. Data shown are mean ± SEM; no statistical analysis was performed, n = 4. (D) SGs in U2OS-WT and ΔΔG3BP1/2 cells, cocultured and treated as indicated, and then stained for G3BP1 (green), FXR1 (red), and eIF3b (blue). SGs in U2OS-WT cells (green arrows) and in ΔΔG3BP1/2 cells (red arrows) are indicated. Bar, 10 µm. (E) SG quantification in U2OS-WT cells (dark bars) and ΔΔG3BP1/2 (light bars), treated as indicated and scored for SGs using eIF4G and eIF3 as markers. Data shown are mean ± SEM and analyzed using the unpaired t test, WT versus ΔΔG3BP1/2. *, P < 0.05; ***, P < 0.005; n = 3. (F) Sorbitol-treated cocultured U2OS-WT (green) and ΔΔG3BP1/2 cells (1 and 2), stained as indicated. 3, sorbitol-treated cocultured mouse eIF2α-S51A MEFs (AA MEFs) and U2OS-WT, stained for G3BP2 (green), FXR1 (red), and eIF3b (blue). SGs in AA MEFs are indicated by white arrows. Insets zoomed 1.3× with separated colors. (G) U2OS-WT cells were untreated (a), EM treated for 45 s (b), EM alone for 15 s and then 0.4 M sorbitol for 30 s (c), or sorbitol alone for 30 s (d). Cells were stained for G3BP1 (green), eIF4G (red), and eIF3b (blue). Insets zoomed 2.3× with separated colors. Arrows indicate SGs. Bars, 10 µm.

