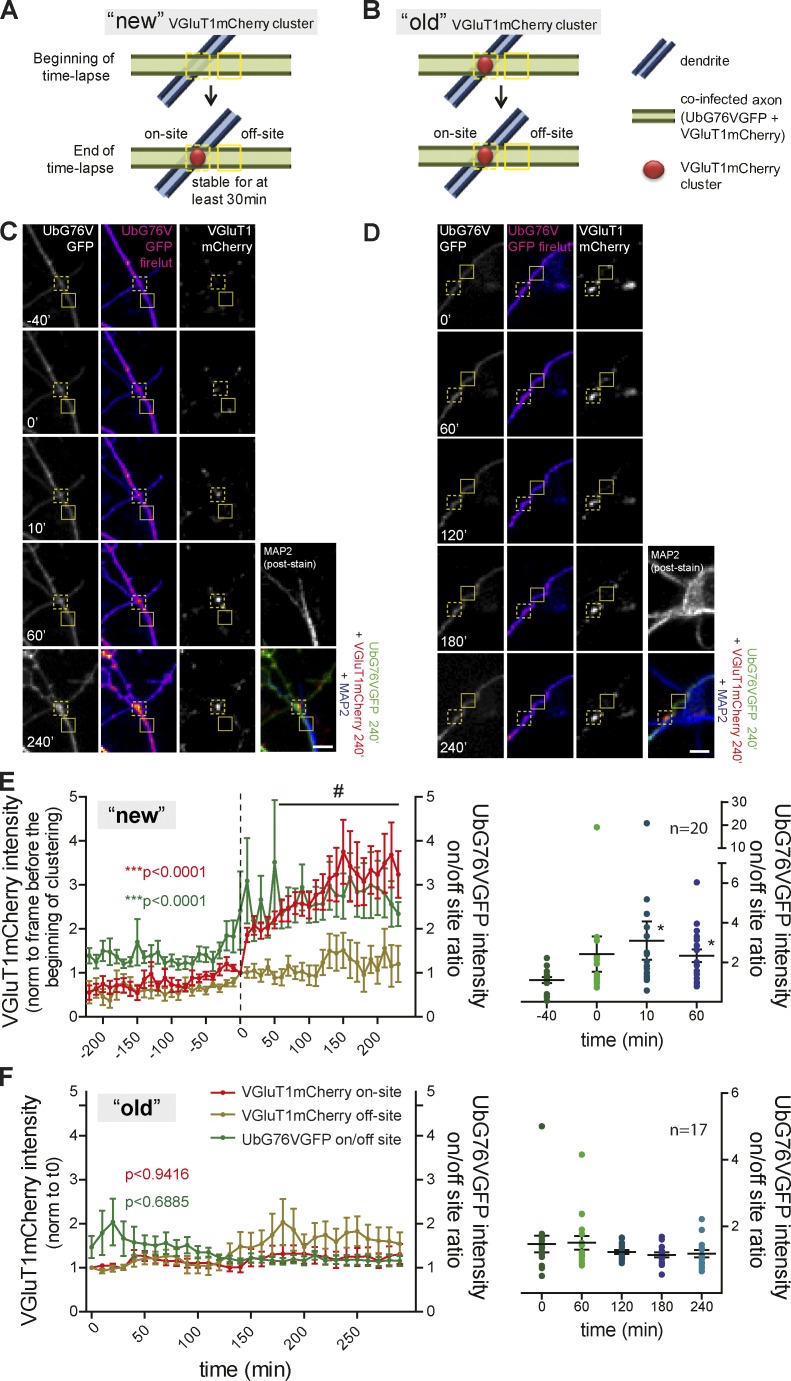
Figure 3.
On-site decreased proteasome activity during formation of stable VGluT1 clusters on dendrites. (A–D) VGluT1mCherry puncta on MAP2+ structures were grouped as “new” (A and C) or “old” (B and D). (C) Increased intensity of UbG76VGFP at the site of clustering (on-site, dashed box) during formation of a new VGluT1mCherry cluster, not observed throughout the lifetime of an old cluster (D). Solid box, off-site. (E and F, left) Time courses of on-site (red line) and off-site (brown line) VGluT1mCherry intensity normalized to time 0 and the on/off-site ratio of UbG76VGFP intensities (green line) for "new" (E) and "old" (F) clusters. For E and F, time 0 corresponds to the frame preceding clustering (dashed line) and the beginning of the time-lapse. VGluT1mCherry (red): #, P < 0.05 for on- versus off-site (***, P < 0.0001, two-way ANOVA). UbG76VGFP ratio (green): ***, P < 0.0001 (Kruskal-Wallis test). (E and F, right) On/off-site ratio of UbG76VGFP intensities at specific time points. *, P < 0.05 in comparison to −40 min (Kruskal-Wallis test followed by the Dunn’s multiple comparison test). n, clusters. Three independent experiments. Results are presented as mean values ± SEM. Bars, 5 µm.

