Figure 1.
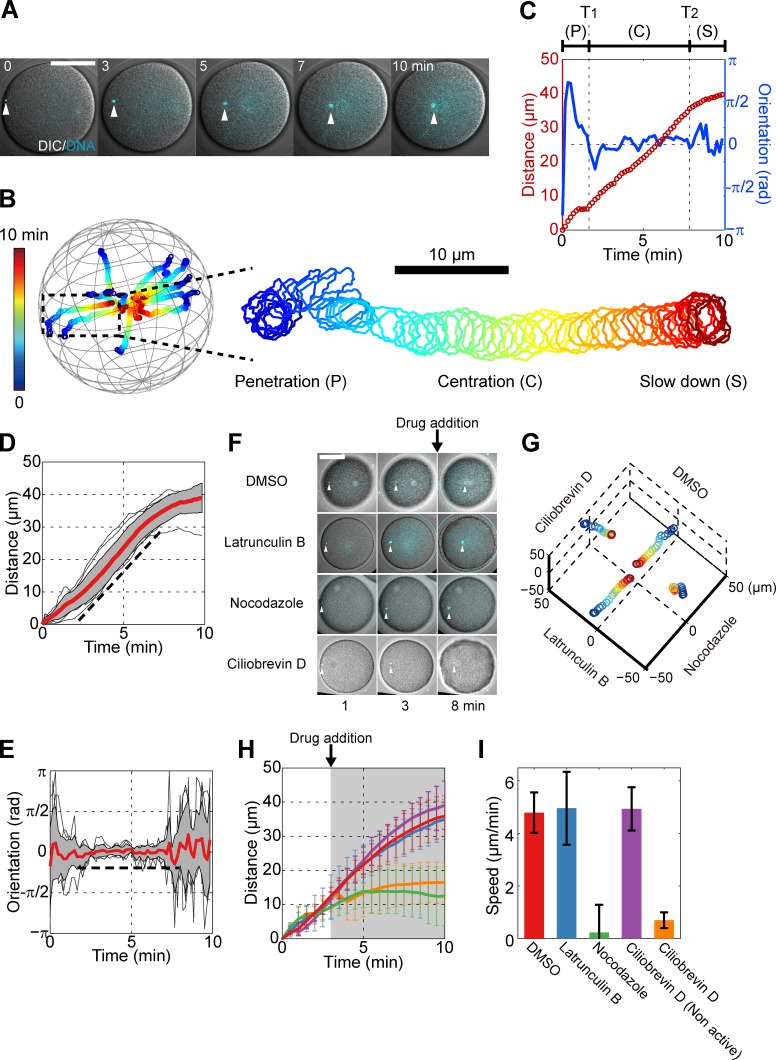
Sperm asters move to the egg center with persistent directionality and constant speed, in a MT- and dynein-dependent manner. (A) Time-lapse confocal images superimposed with differential interference contrast (DIC) of a male pronucleus (white arrowhead) at the center of a sperm MT aster. (B) 3D trajectories of 10 individual asters and enlarged trajectory of an aster that migrates mostly in-plane. Time is color-coded. The centration is subdivided into three phases: an initial penetration phase (P), a rapid centration phase with straight path and constant speed (C), and a final slowing-down phase (S). (C) Aster traveling distance and orientation toward the cell center as a function of time, for the sample enlarged in B. T1 and T2 denote the beginning and end of the rapid centration phase. (D and E) Distance and orientation time plots for 10 individual asters. Red line, mean; gray section, SD. The broken line is a guide for the eyes. (F) Time-lapse images of eggs treated with different inhibitors 3 min after sperm entry. (G) 3D trajectories corresponding to the eggs and conditions from F. Time is color-coded as in B. (H) Mean aster traveling distance as a function of time in the presence of inhibitors. The gray region indicates the period during which inhibitors are present. Red, DMSO (n = 5); blue, 20 µM latrunculin B (n = 5); green, 20 µM nocodazole (n = 7); purple, 50 µM ciliobrevin D nonactive analog (n = 6); and orange, 50 µM ciliobrevin D (n = 6). (I) Aster speed computed using the distance–time curve between 5 and 7 min. Error bars represent SD. Bars, 50 µm.

