Figure 3.
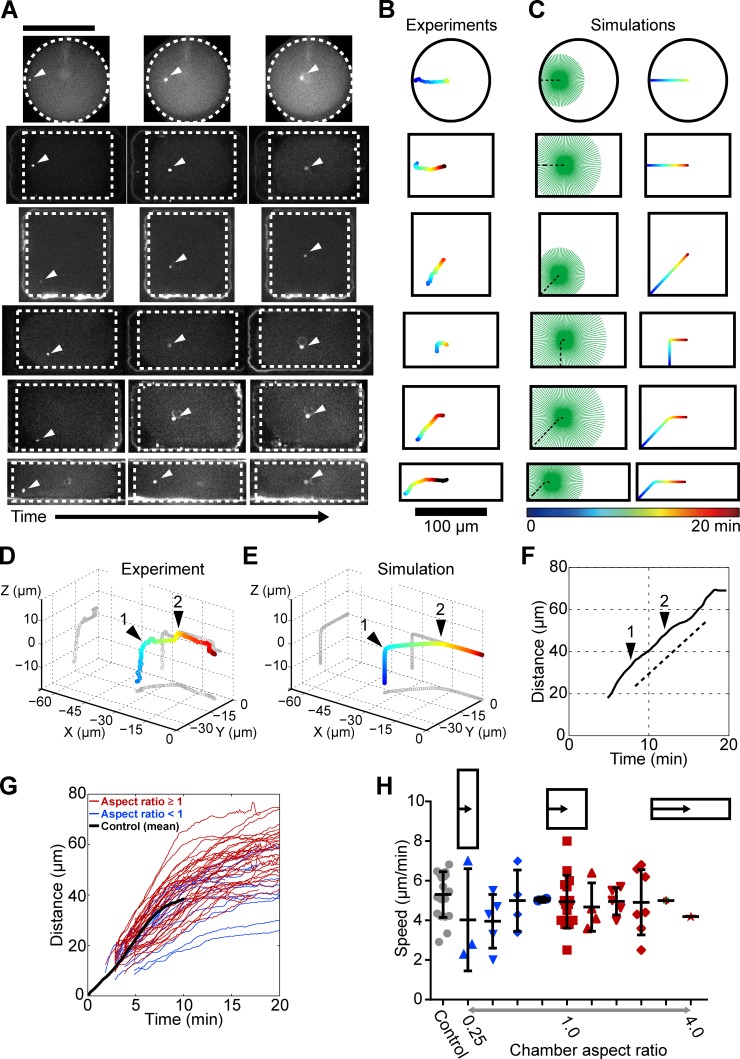
Aster geometry determines aster directionality. (A) Time lapses of aster centration in shape-manipulated eggs. (B) Centering trajectories for the time lapses presented in A. (C) Corresponding numerical simulations. (D) 3D centering trajectory of a sperm aster exhibiting two subsequent turning points (black arrowheads). The plot volume corresponds to a cell quarter with X = Y = Z = 0 marking the cell center. (E) Numerical simulation corresponding to D. (F) Distance–time plot for the centration trajectory presented in D, with black arrowheads marking the turning points. (G) Distance–time curves for 35 centering asters in various cell geometries. Shape aspect ratio: red, ≥1; blue, <1. The black line is an averaged distance–time curve for normal spherical cells. (H) Aster speed in different cell geometries. Error bars represent ±SD. Bars, 100 µm.

