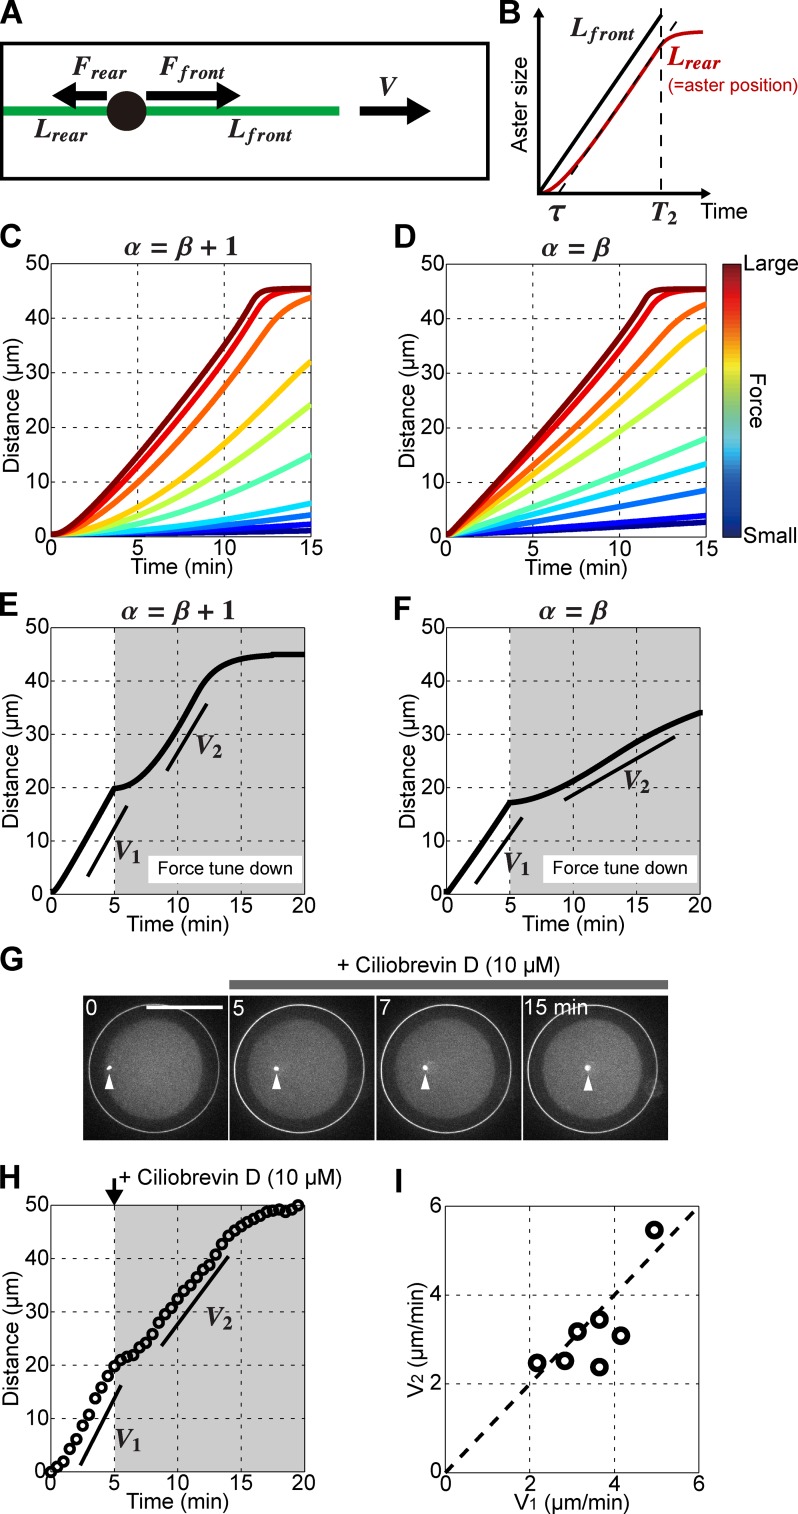
Figure 4.
Speed determination in growing asters. (A) 1D model of a centering aster. Each MT exerts a pulling force F that scales to its length L. The aster moves with a speed V. (B) Time evolution of MT lengths in the model. Note that Lrear is equal to aster position in the model. τ and T2 correspond to the time needed to reach constant speed and to the time at which the front MT contacts the opposite cortex. (C and D) 3D simulations for various force parameter values and for the two scaling conditions linking α and β. (E and F) Simulations assessing the impact of abruptly reducing the force amplitude in the two different scaling conditions. The force parameter was decreased by a factor 20 in the simulation at 5 min (G) Confocal time lapse of a centering aster treated with a low dose of 10 µM ciliobrevin D at 5 min after sperm entry. (H and I) Aster speed before (V1) and after (V2) ciliobrevin D treatment. (I) V2 plotted as a function of V1 for seven individual eggs. Broken line marks V1 = V2. Bars, 50 µm.

