Figure 2.
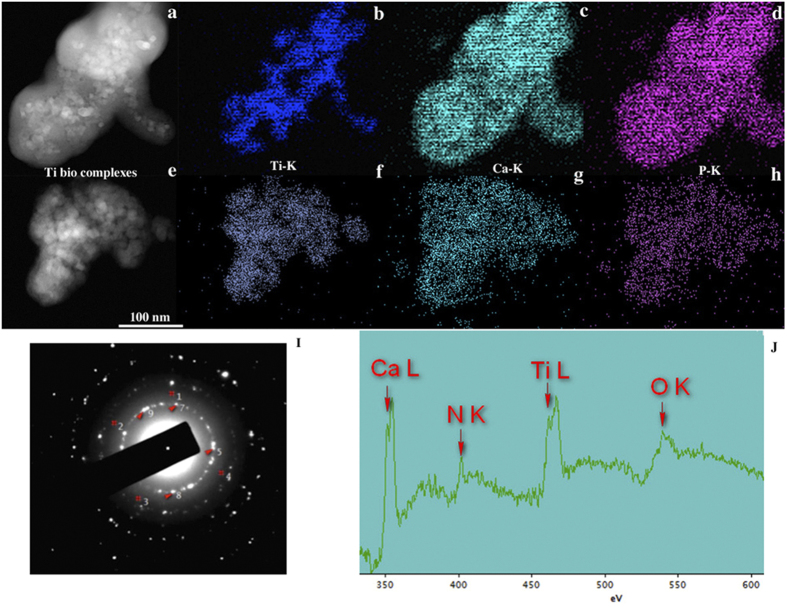
Concentration dependent of anatase bio-complexes formation in medium culture: 10 μg/mL anatase (a) Dark-field STEM image showing where the corresponding elemental maps were obtained; (b) STEM/EDS Ti-K map; (c) STEM/EDS Ca-K map; (d) STEM/EDS P-K map. 100 μg/mL anatase (e) Dark-field STEM image showing where the corresponding elemental maps were obtained; (f) STEM/EDS Ti-K map; (g) STEM/EDS Ca-K map; (h) STEM/EDS P-K map. (I) Diffraction pattern of {211} hydroxyapatite nanocrystals planes (marked as#) and anatase nanocrystal planes used for calibrating, d {101} = 0.351 nm (5, 7,8 and 9). (J) EELSpectrum of 100 μg/mL of anatase in culture medium.

