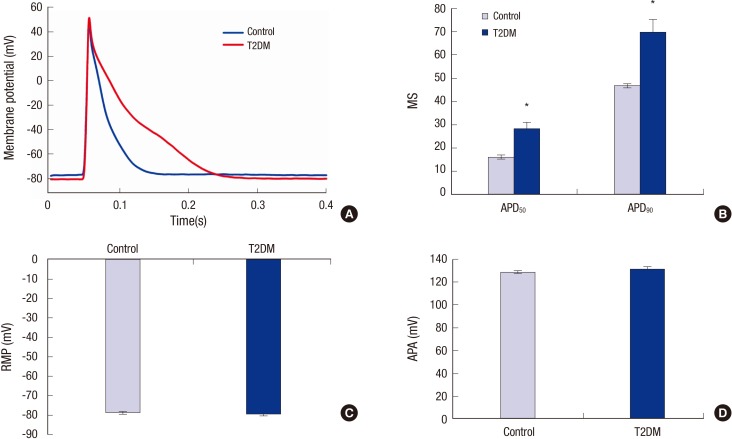
Fig. 4.
Recordings of action potentials in left atrial myocytes from control and type 2 diabetic rats. (A) Representative recordings of action potentials in left atrial myocytes from control (blue) and diabetic (red) rats. (B) Pooled data for APD at 50% (APD50) and 90% (APD90) repolarization in control (n = 11 cells from 3 rats) and diabetic rats (n = 11 cells from 3 rats) rats. (C) Summary data of resting membrane potential (RMP) in control (n = 11 cells from 3 rats) and diabetic (n = 11 cells from 3 rats) rats. (D) Summary data of action potential amplitude (APA) in control (n = 11 cells from 3 rats) and diabetic (n = 11 cells from 3 rats) rats. *P < 0.001 vs. control.

