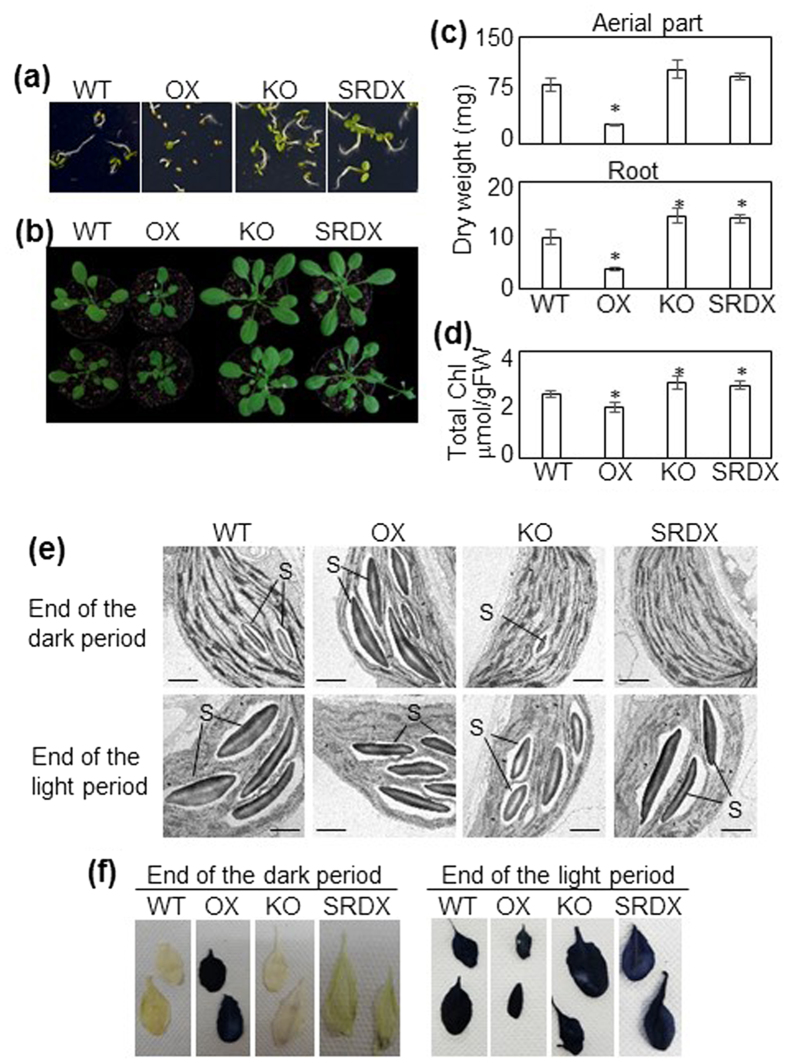
Figure 3. Phenotypes of ANAC046 transgenic plants.
(a) Seedlings grown on MS-agar 4 days after sowing (DAS). (b) Plants grown in soil at 40 DAS. (c) Dry weight of aerial parts and roots of 40-DAS plants. Bars indicate standard error (10 biological replicates). (d) Chlorophyll content in the 8–9th leaves of 40-DAS plants. Bars indicate standard error (4 biological replicates). The presence of starch in rosette leaves of 40-DAS plants detected by (e) transmission electron microscopic imaging of chloroplasts and (f) iodine staining. S, starch granules. Scale bars = 1 μm. Asterisks indicate significant differences between WT and OX, KO, or SRDX according to Student’s t-test (*P < 0.05).

