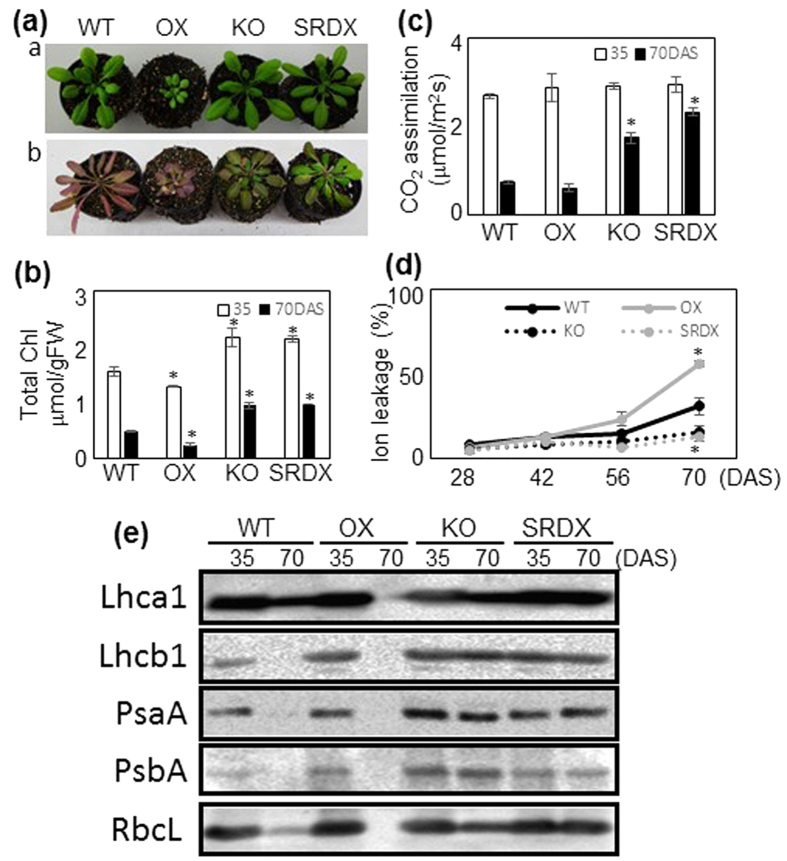
Figure 4. Age-dependent senescence in WT and ANAC046 transgenic plants.
(a) Plants at 35 DAS (a) and 70 DAS (b). (b) Chlorophyll content and (c) CO2 assimilation rate of 35- and 70-DAS plants. Bars indicate standard error (4 biological replicates). Asterisks indicate significant differences between WT and OX, KO, or SRDX plants at each sampling time according to Student’s t-test (*P < 0.05). (d) Ion leakage rate of 28-, 42-, 56-, and 70-DAS plants. (e) Western blotting of photosynthetic proteins. Protein extract equivalent to 1.0 mg of leaf tissue per lane was subjected to SDS-PAGE.

