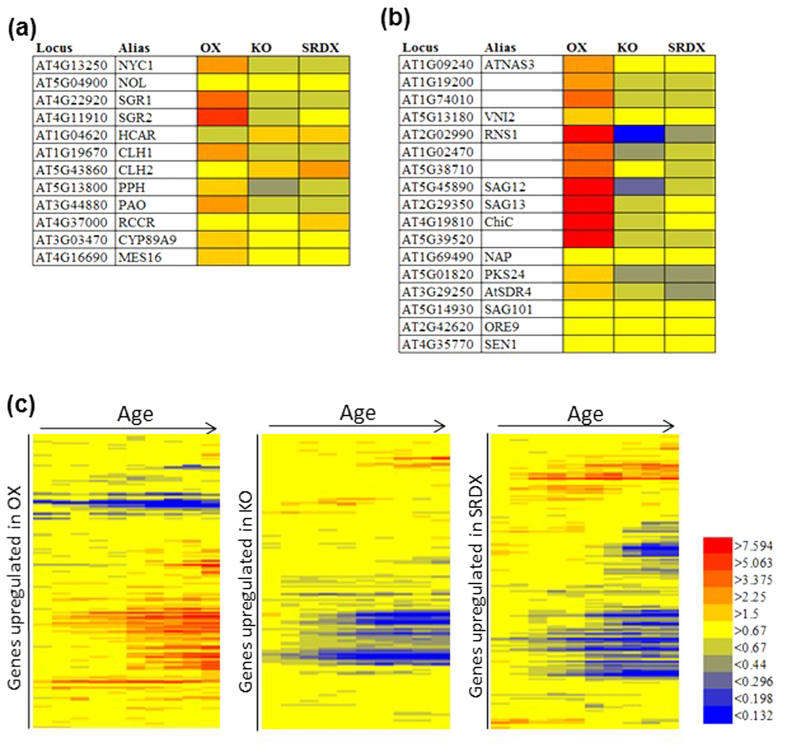
Figure 6. Microarray analysis of ANAC046 transgenic plants.
Heat maps of fold changes in the expression of (a) Chl catabolic genes, (b) other senescence-related genes, and (c) age-dependent changes in the expression levels of genes upregulated in the OX, KO, and SRDX plants. Gene expression data along plant age (c) were obtained from a public database30. Fold change of expression in afternoon of 21, 23, 25, 27, 29, 31, 33, 35, 37, and 39 days after sowing (DAS) over one in afternoon of 19DAS is shown by color from left to right.

