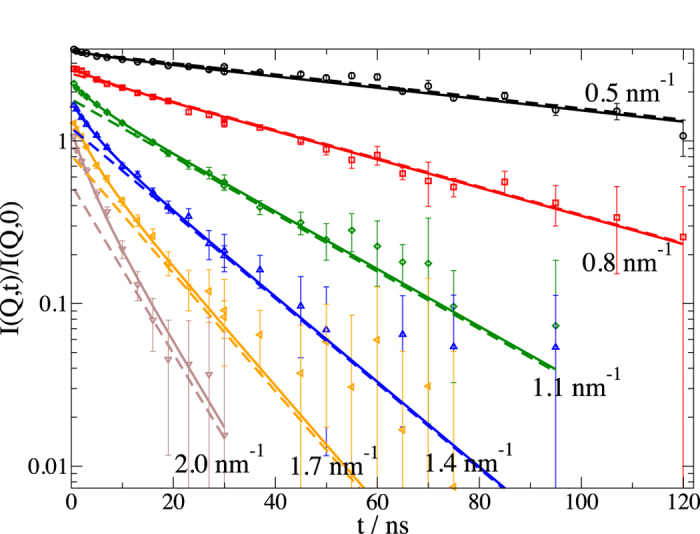
Figure 4. Intermediate scattering functions I(Q,t)/I(Q.

,0) of IgG. The Q values are 0.5 nm−1, 0.8 nm−1, 1.1 nm−1, 1.4 nm−1, 1.7 nm−1and 2.0 nm−1 as indicated. Spectra were shifted for clarity upwards by a consecutive factor of 1.3, with the highest Q not shifted. Solid lines in the same color represent the fit by equation (5) with contributions from translational and rotational diffusion from equation (6) & (7) and internal dynamics described by equation 10 with 9 degrees of freedom as described in the text. Dashed lines correspond to the contribution of translational and rotational diffusion and are close to a single exponential for times t > 15 ns. The amplitude of internal dynamics is the difference between the contribution of diffusion and the observed signal, respectively the solid line of the fit curve.
