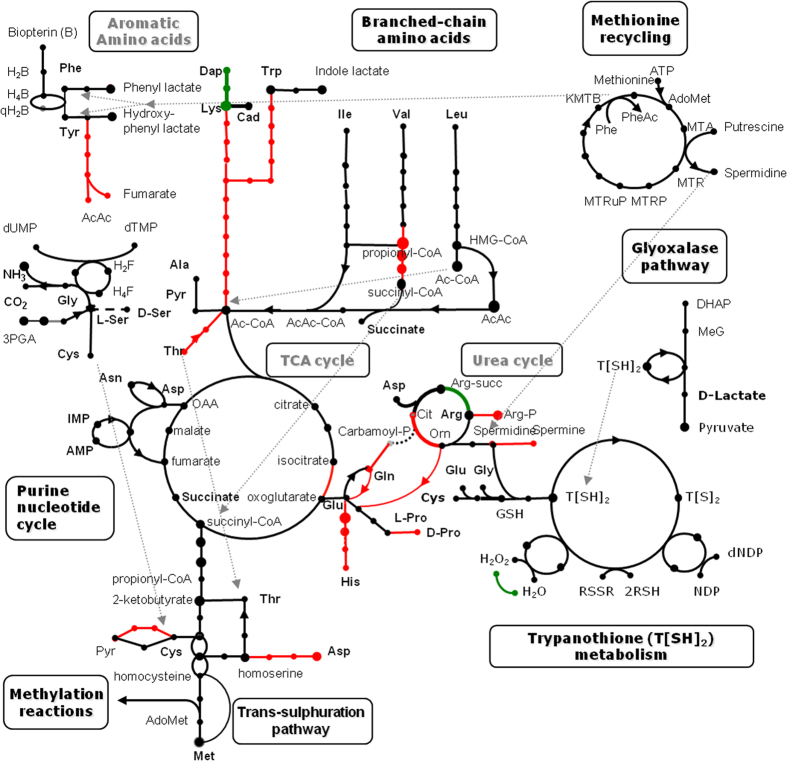
Figure 1. Schematic representation of Leptomonas pyrrhocoris amino-acid metabolism and some related pathways.
Each dot represents a metabolite and each line represents the presence or absence of a predicted enzyme. Color coding: black, enzyme present; red, enzyme present in most free-living eukaryotic organisms, but lost in L. pyrrhocoris; green, enzyme present in L. pyrrhocoris and Crithidia fasciculata, but absent in Leishmania.

