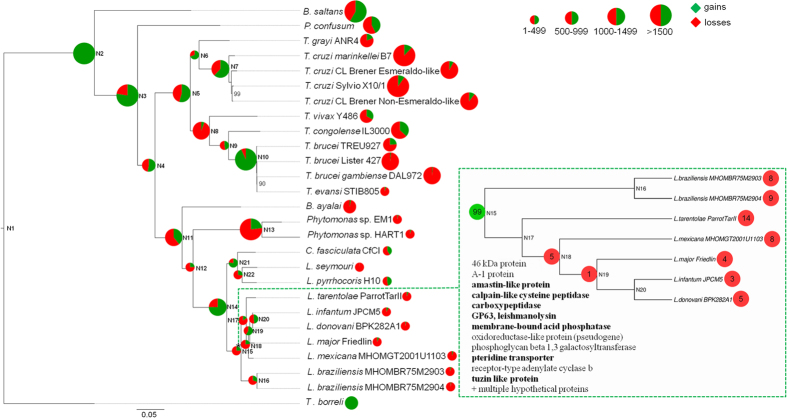
Figure 2. Gene family gains/losses mapped on the tree of kinetoplastids using Dollo parsimony algorithm.
The maximum likelihood tree is based on the alignment of 57 conserved proteins and inferred using the LG + Г + F model and 1,000 bootstrap replicates. Only bootstrap support values lower than 100% are shown. The horizontal bar represents 0.05 substitutions per site. Gene gains dominate at the basal node of trypanosomatids, and at the basal nodes of Leishmaniinae, Leptomonas/Crithidia, American trypanosomes, T. cruzi, and T. brucei. The other internal nodes and leafs are either dominated by losses or have almost equal counts of gains and losses. An inset figure on the right depicts the losses for 99 OGs gained at the Leishmania node. Annotations for proteins within these OGs are shown at the bottom left corner of the inset. Annotations of the known proteins implicated in virulence are in bold.

