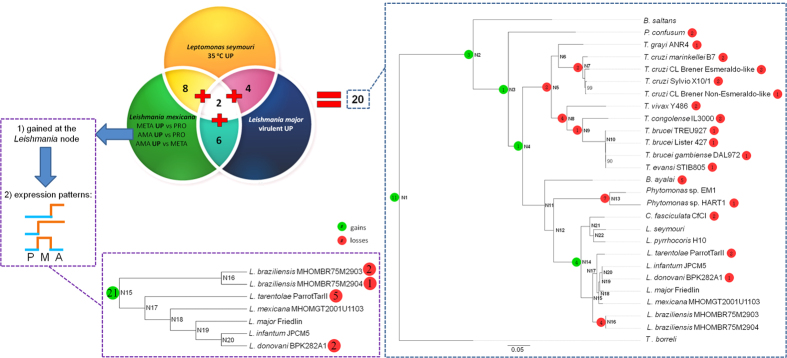
Figure 3. Approaches used for identification of novel Leishmania virulence factors.
The Venn diagram represents two- and three-way intersections between differential expression datasets (A) (Leptomonas seymouri genes up-regulated at elevated temperature of 35 °C compared to 23 °C), (B) (genes up-regulated in a Leishmania major LV561 virulent isolate compared to an avirulent one), and (C) (differential expression data for L. mexicana developmental stages). Two phylogenetic trees of kinetoplastids with gene family gains/losses mapped using Dollo parsimony algorithm are shown. Gain and loss counts for 20 OGs obtained through overlapping the differential expression datasets are depicted in the tree on the right. The Leishmania cladogram at the bottom shows gains and losses for 21 OGs containing 40 L. mexicana genes gained at the Leishmania node and having differential expression patterns suggesting a potential role in virulence. Leishmania life cycle stages are abbreviated as follows: PRO or P, procyclics; META or M, metacyclics; AMA or A, amastigotes.

