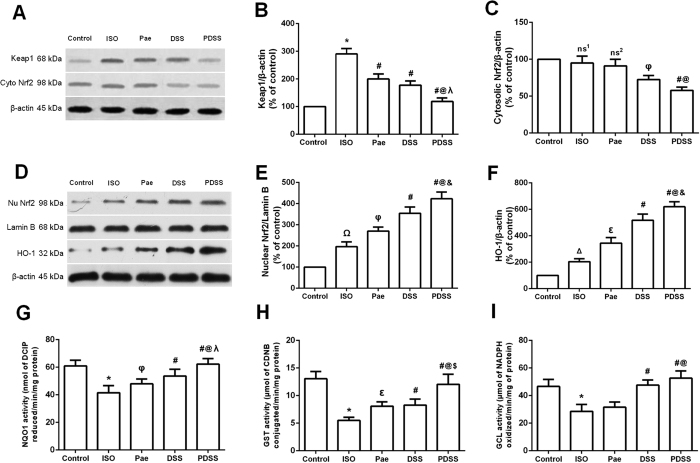
Figure 4. Effect of PDSS on ISO-induced changes in myocardial nuclear translocation of nuclear factor erythroid 2-related factor 2 (Nrf2) and activities of the phase II enzymes.
Graphs represents the (A) Immunoblot of myocardial Keap1 and cytosolic Nrf2 protein expressions; densitometry analysis of (B) Keap1 and (C) cytosolic Nrf2 protein expressions; (D) Immunoblot of myocardial nuclear Nrf2 and heme oxygenase-1 (HO-1) protein expressions; densitometry analysis of (E) nuclear Nrf2 and (F) HO-1 protein expressions; myocardial G NAD(P)H:quinine oxidoreductase 1 (NQO1), (H) glutathione-S-transferase (GST) and (I) γ-glutamylcysteine ligase (GCL) activities. Values are expressed as mean ± S.D. (n = 3 in immunoblot and n = 8 in assay of phase II enzymes activities, respectively). ns1–non significant vs. Control, ΔP < 0.05 vs. Control, ΩP < 0.01 vs. Control; ns2–non significant vs. ISO, φP < 0.05 vs. ISO, εP < 0.01 vs. ISO, #P < 0.001 vs. ISO; @P < 0.001 vs. Pae; &P < 0.05 vs. DSS, λP < 0.01 vs. DSS, $P < 0.001 vs. DSS (one-way ANOVA).

