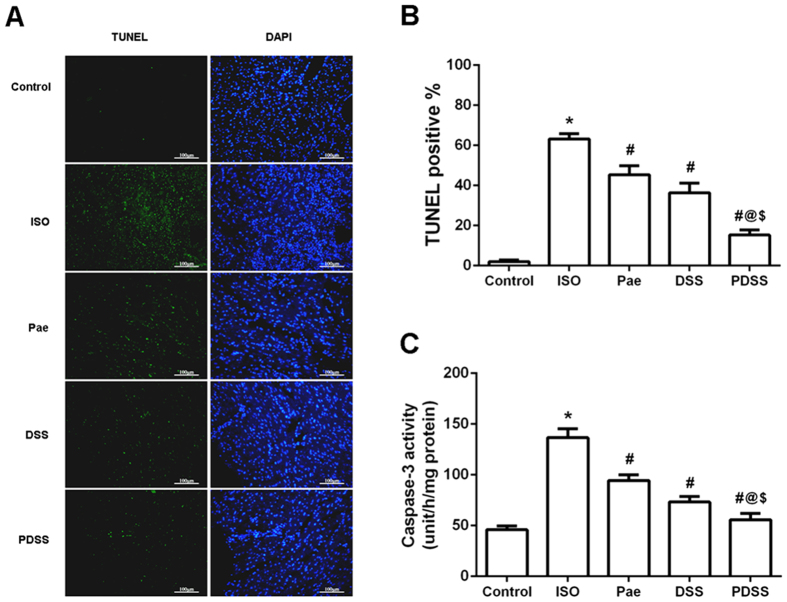
Figure 5. Effect of PDSS on ISO-induced myocardial apoptosis in vivo.
(A) Representative photographs of TUNEL staining in different groups. Myocardial tissues were stained and analyzed with TUNEL (green) and counterstained with DAPI (blue). (B) Quantitative analysis of TUNEL positive cells. The percentage of TUNEL positive cells was expressed as percent DAPI stained cells. (C) Myocardial caspase-3 activity. Values are expressed as mean ± S.D. (n = 3 in TUNEL staining and n = 8 in assay of caspase-3 activity, respectively). *P < 0.001 vs. Control; #P < 0.001 vs. ISO; @P < 0.001 vs. Pae; $P < 0.001 vs. DSS (one-way ANOVA).

