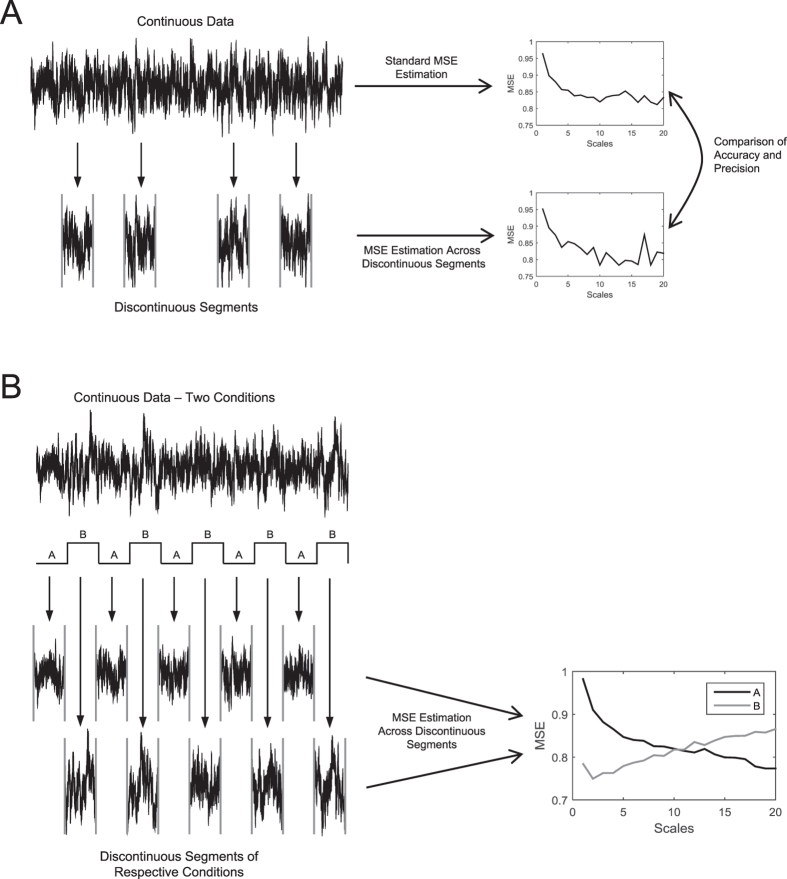
Figure 1. Schematic representation of the rationale of MSE estimation across discontinuous segments of a time series.
(A) Sampling of discontinuous segments from a continuous time series and subsequent comparison of MSE estimates across discontinuous segments with MSE estimates from continuous time series. Here, accuracy denotes the absolute deviation of (a) MSE values from discontinuous segments from (b) the ‘benchmark’ MSE values from continuous data. Precision is defined as the standard deviation (SD) of the distribution of MSE values around their mean (e.g., across simulation runs, or across subjects). (B) Example for an application. Extraction of respective discontinuous data segments from a block design with two conditions (A,B) and subsequent MSE estimation across these discontinuous segments.

