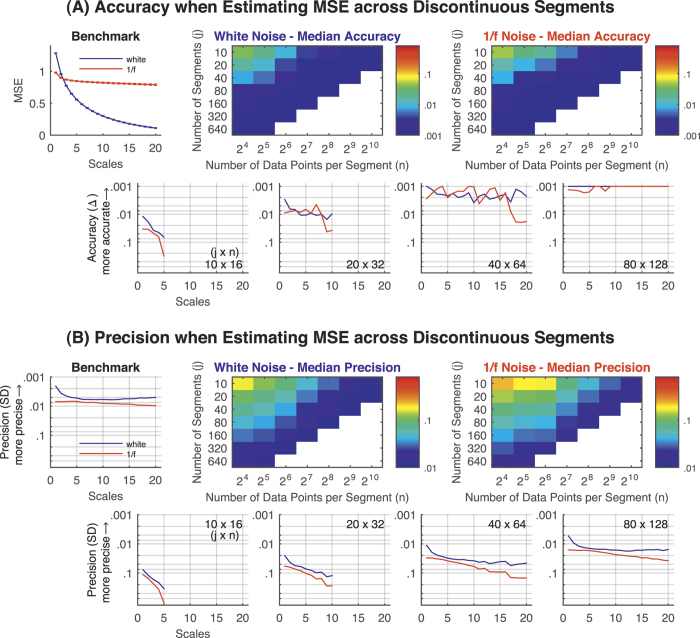
Figure 3. MSE simulations using white and 1/f noise.
Accuracy and precision of MSE estimates for white and 1/f noise up to scale 20 when estimating the MSE across j ( = 10 to 640) discontinuous segments of n ( = 16 to 1,024) data points. (A) Accuracy. The average MSE values across 1,000 randomly generated time series with 216 (65,536) continuous data points served as the benchmark for accuracy estimation. Benchmark MSE values are shown in the upper left plot. Heat maps provide the median accuracy across scales for each combination of j segments of n data points; MSE values were estimated only for non-white cells. Color bars indicate the (logarithmic) scaling of the median accuracy values. Note that diagonals from the bottom left to the top right refer to approximately the same number of pattern comparisons. In the lower row, representative examples of j × n combinations are provided. (B) Precision. Heat maps provide the median precision across scales for each combination of j segments of n data; MSE was estimated for non-white cells. Color bars indicate the (logarithmic) scaling of the median precision values. In the lower row, representative examples of j × n combinations are provided. Note. Error bars indicate the SD of the MSE values across 1,000 randomly generated time series. Accuracy and precision are given in log10 scaling with smaller values plotted upwards. MSE = multi-scale entropy; Δ = absolute average difference between benchmark MSE and MSE estimated across discontinuous time series with a reduced overall amount of data points; SD = standard deviation.

