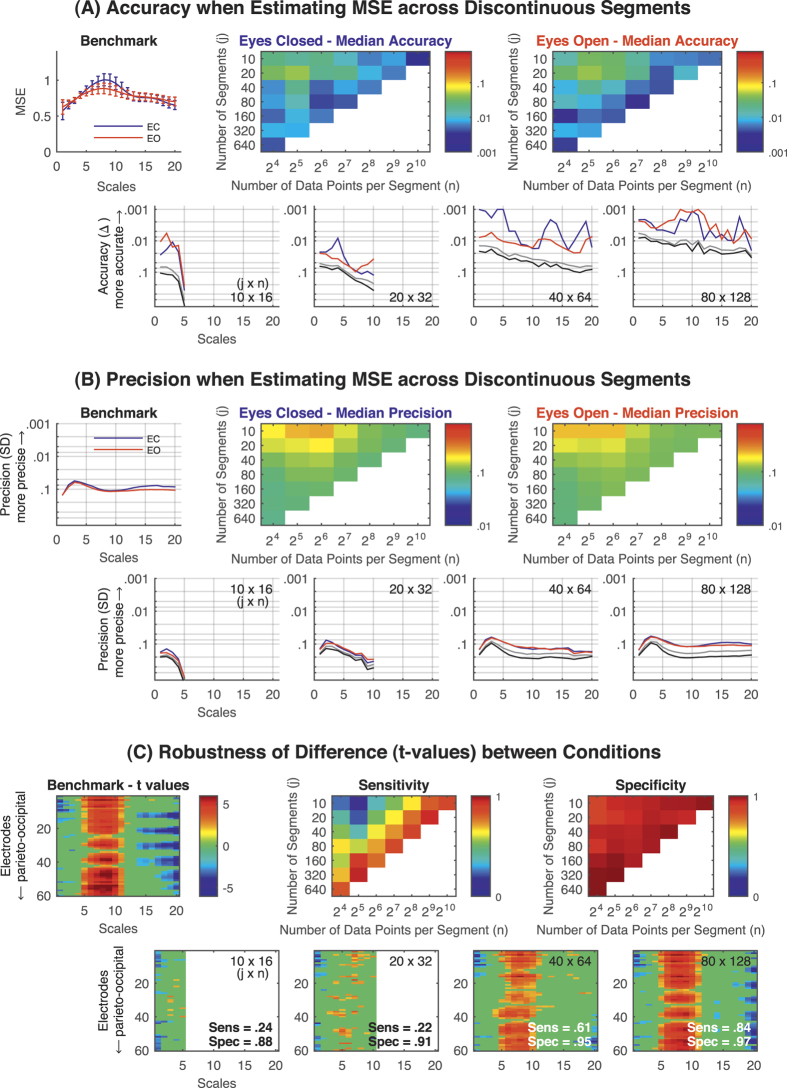
Figure 4. Resting state EEG data [eyes closed (EC) and eyes open (EO)].
(A) Accuracy and (B) Precision. MSE estimates—up to scale 20—across j ( = 10 to 640) discontinuous segments of n ( = 16 to 1,024) data points. MSE values estimated across 20 × 210 (20 × 1,024) data points, averaged across all electrodes and participants (N = 19) served as the benchmark [shown in the upper left plots of (A) and (B)]. Heat maps provide the median accuracy (A) and precision (B) across scales for each j × n combination. Color bars indicate the (logarithmic) scaling of values. Diagonals from the bottom left to the top right refer to approximately the same number of pattern comparisons. In the lower row, representative examples of j × n combinations are provided. Grey lines indicate the 95th percentile and black lines the maximum (worst) accuracy and precision values across electrodes, respectively. (C) Robustness of statistical differences between conditions. Upper left heat map: t values from the MSE comparison between EC and EO. Non-significant scale × electrode points are masked out (green). Upper middle and right heat map: sensitivity and specificity of detecting significant differences between conditions across the scale × electrode space when reducing the amount of data used for MSE estimation. Sensitivity systematically decreases with decreasing amounts of data without introducing many false positives (stable specificity). The lower row provides representative t value maps for four j × n combinations; same scaling as the benchmark t value map. Note, that for short segments (i.e., 16 data points), scales containing the maximum difference between conditions cannot be obtained (e.g., lower row, leftmost plot). Note. Error bars indicate the SD of the average MSE values across participants (N = 19). Accuracy and precision are given in log10 scaling with smaller values plotted upwards. In heat maps, values were estimated only for non-white cells. MSE = multi-scale entropy; Δ = absolute average difference between benchmark MSE and MSE estimated across discontinuous time series with a reduced overall amount of data points; SD = standard deviation; Sens = sensitivity; Spec = specificity.

