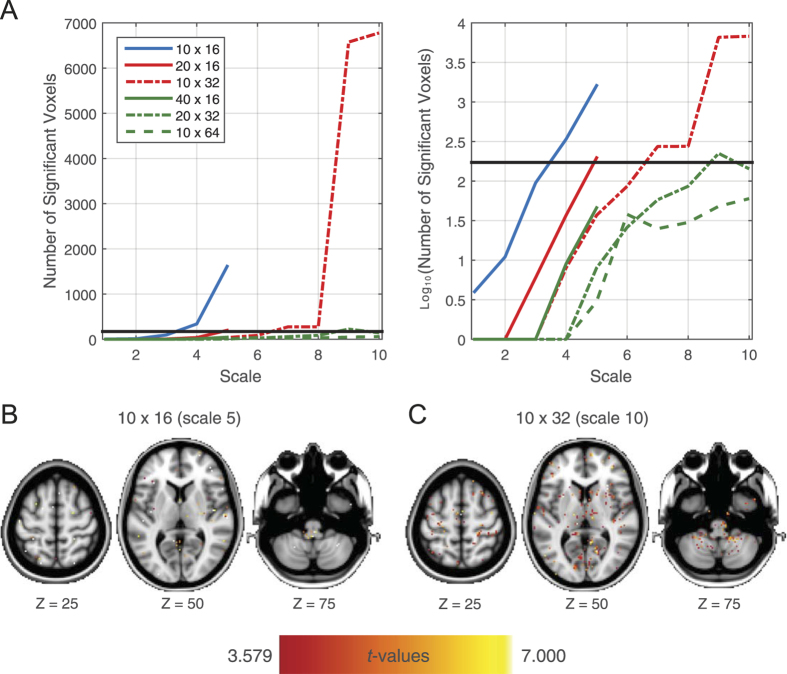
Figure 7. fMRI: number and spatial distribution of voxels where accuracy deviated reliably from the overall accuracy.
(A) Number [and log10(number)] of reliably deviating voxels as a function of time scale and j (number of data segments) × n (data points per segment) combination. The black horizontal line indicates the number of voxels that would be detected by chance at an uncorrected p of 0.001. Note, that the blue, red, and green lines correspond to 160, 320, and 640 overall data points (across segments), respectively, thus denoting approximately the same amount of pattern comparisons. (B) and (C) The spatial distribution of the reliably deviating accuracy values from the overall accuracy (as indexed by the t values) for the two worst cases [(B): 10 × 16, scale 5; (C): 10 × 32, scale 10] indicates that accuracy values are randomly distributed across the brain.

