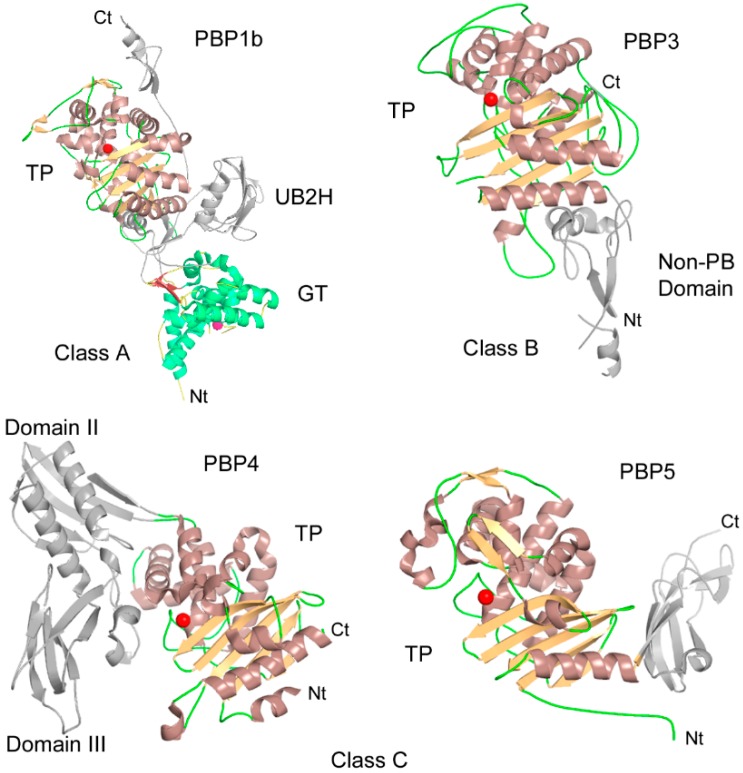
Figure 2.
Structure of E. coli class A PBP1b [34], class B PBP3 [32], class C PBP4 [35], and class C PBP5 [36]. The TP domains are shown with brown helices and orange strands, the red sphere indicating the position of the active site serine. The PBP1b GT domain is shown with helices colored in lime green and strands in brick color. The GT catalytic centre (Glu233) is shown with a pink sphere.

