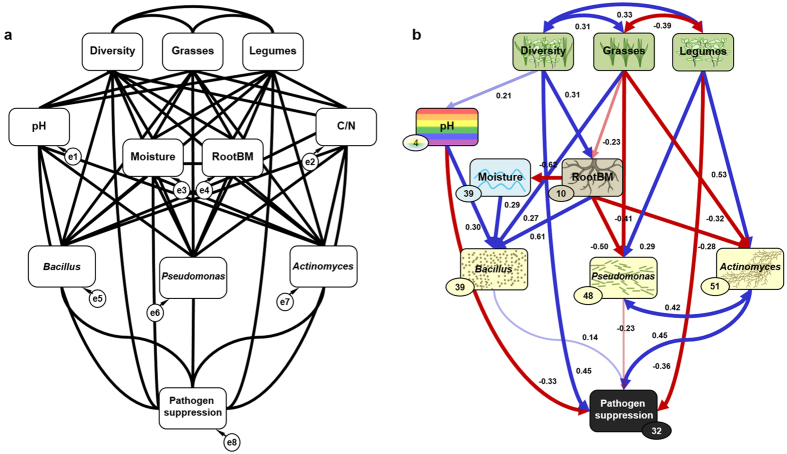
Figure 2. Structural equation model.
The initial model (a) and the final model (b) with direct and indirect (through changes in soil pH, root biomass, soil moisture, and bacterial abundances) effects of plant community composition on pathogen suppression. Exogenous variables (plant diversity and functional group affiliation) are given on top, endogenous variables below. The data did not significantly deviate from the respective models (see main text for model fits). Single-headed arrows represent causal relationships and double-headed arrows indicate undirected correlations. Numbers on arrows give standardized path coefficients. Blue arrows indicate positive and red negative relationships; bold arrows indicate significant (P ≤ 0.05), medium size arrows indicate marginally significant (P ≤ 0.1), and thin arrows non-significant (P > 0.1) estimates. Circles indicate error terms (e1–e8). Numbers close to endogenous variables indicate the variance explained by the model (R2; percent).

