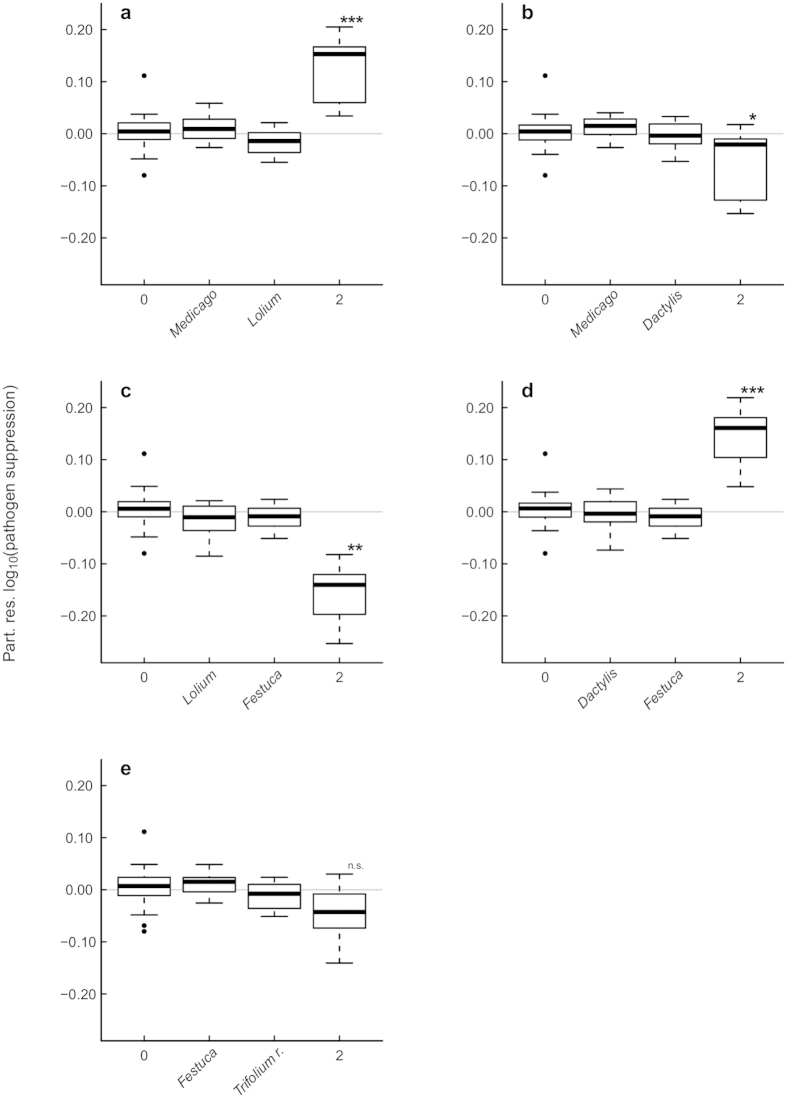
Figure 3. Partial residuals of log10-transformed pathogen suppression.
(a) Medicago and Lolium, (b) Medicago and Dactylis, (c) Lolium and Festuca, (d) Dactylis and Festuca, (e) Festuca and Trifolium r. First box per graph indicates both plant species being absent “0”; the second and third box indicate named plant species being present and the other being absent; the fourth box indicates both plant species being present “2” (left to right). Interaction effects were tested against zero (two-tailed t-test). Asterisks denote the level of significance: *P ≤ 0.05, **P ≤ 0.01, ***P < 0.001.

