
Figure 4. Quantification of calcification and dissolution using calcein.
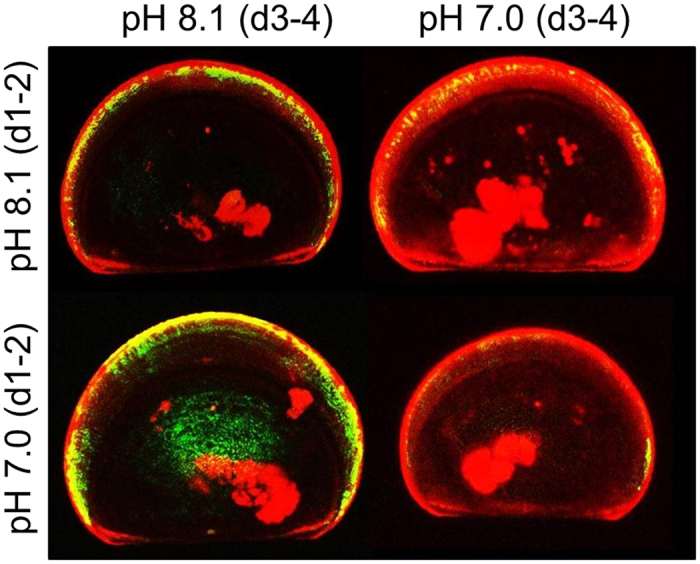
Confocal image of calcein-labelled skeleton of 11 day old D-shaped larvae of M. edulis cultured for 2 days in green calcein (d1-2, green signal) at either pH 8.1 or pH 7.0 and then transferred for 2 days in blue calcein (d3-4, red signal). Larvae exposed to pH 7.0 at days 3–4 have a larger red band revealing increased calcification as well as less green signal suggesting higher dissolution.