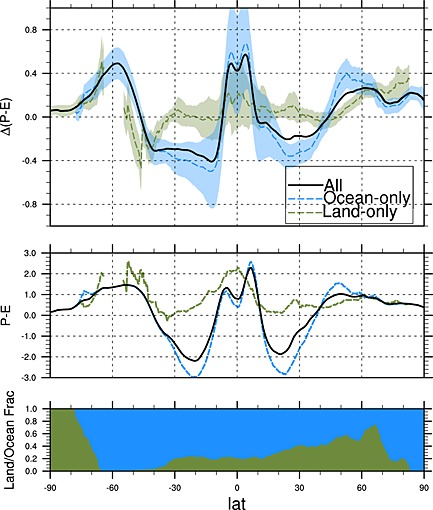
Figure 1.

The zonal mean Δ(P − E) (1980–99 vs 2080–99, top panel) and P − E of the present climate(1980–99, middle panel) from the ensemble mean of 35 CMIP5 model runs (black), for ocean grid points only (blue) and for land grid points only(green). The shading denotes the ensemble standard deviation. The overall result (black line) corresponds very well to the finding of Held and Soden [2006]. However, the distinction between land and ocean grid points reveals fundamental differences. Over land the zonal mean drying trends are, if any, very small and not significant in subtropical regions. The figure clearly shows that the overall signal[Held and Soden, 2006] is dominated by the ocean signal (which makes sense regarding the unequal distribution of zonal land area vs. ocean area, bottom panel). The figure further shows that P − E > 0 over land and thus technically all land regions are wet (middle panel). (Figure taken from G14, supporting information.)
