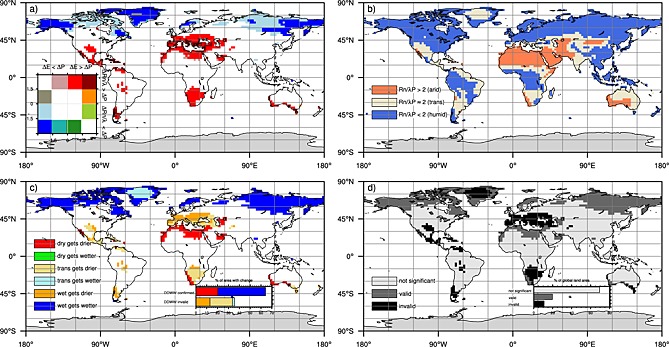
Figure 4.

Investigating the DDWW paradigm. (a) Significant drying/wetting trends computed at the grid box level. Dark red (dark blue) denotes a significant change toward drier (wetter) conditions regarding both the land water balance and hydrological regime shifts. Red/orange shows a shift toward more arid conditions. Drying due to changes in the land water balance only is depicted by green/pink color. (b) Distribution of arid (orange) to humid (blue) areas within the period from 1980 to 2000. Beige colors denote transitional areas where no significant attribution is possible. (c) Comparing the changes in Figure 4a with the hydrological conditions in Figure 4b yields an evaluation of the “dry gets drier, wet gets wetter” paradigm. Red/dark blue colors indicate regions where the paradigm is found to be valid. Humid areas getting drier (orange) are widely found. (d) Conceptual evaluation of the DDWW, with areas confirming (dark grey) and invalidating (black) the paradigm compared to areas showing no robust trend. Note that Antarctica is not accounted for in the subplots.
