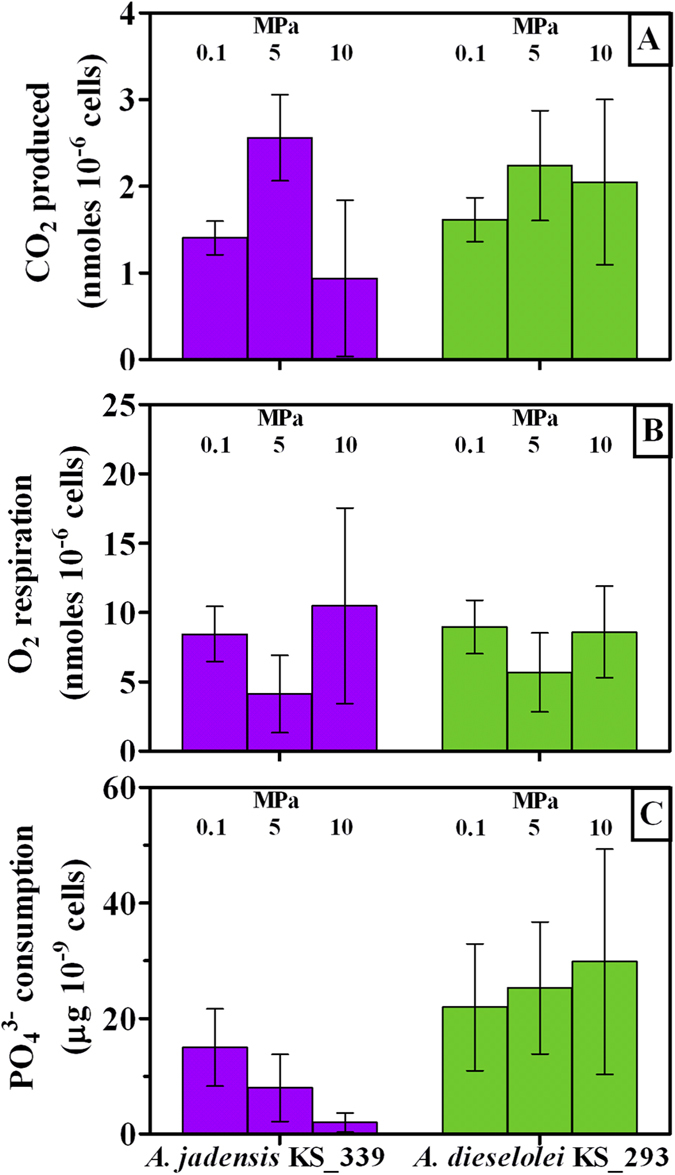
Figure 3. Physiological response in A. jadensis KS_339 (purple) and A. dieselolei KS_293 (green) under atmospheric (0.1 MPa) and mild pressure (5 and 10 MPa).

Bars indicate 95% confidence intervals. All values refer to the final cell number and amounts detected at the end of the incubation. (A): CO2 production per cell; (B): O2 respiration per cell; (C): PO43− uptake per cell.
