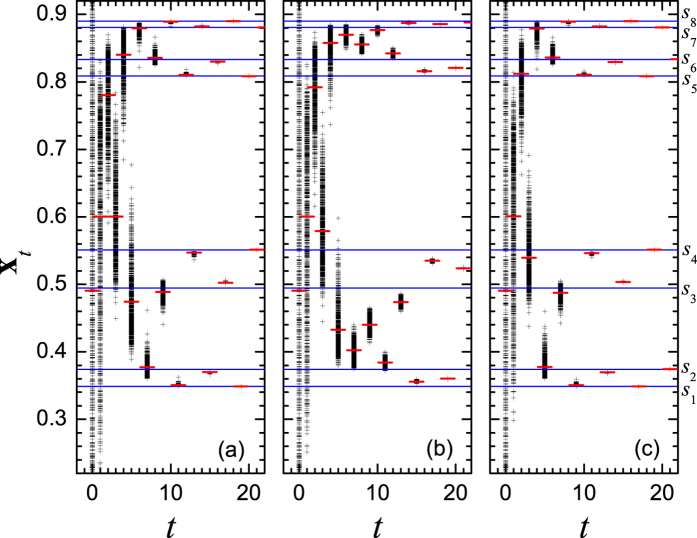
Figure 3.
The time series of node states xt for three different coupling strengths: (a) ε = 0.45, (b) ε = 0.50, and (c) ε = 0.60. The plus (+) indicates the state on each node, the minus (−) indicates the average value of all node states. The lines indicates the trajectories of P-8 orbit, marked by s1, s2, ..., and  , respectively. The control parameter of the single map is μ = 3.56.

