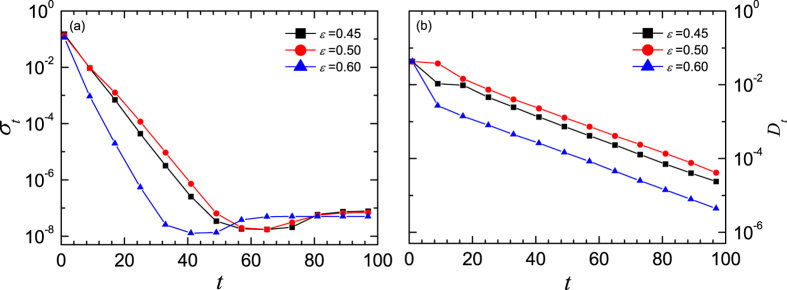
Figure 4.
The time series of the standard deviation of node states (a) and the distance of the mean state to the stable orbit (b). Where, the ensemble average is done for 105 realizations. For clearness, the data points are drawn at every 8-step, considering the P-8 cycle. The squares represent the case of ε = 0.45, the circles represent that of ε = 0.50, and the triangles are for ε = 0.60. The control parameter of the single map is μ = 3.56.

