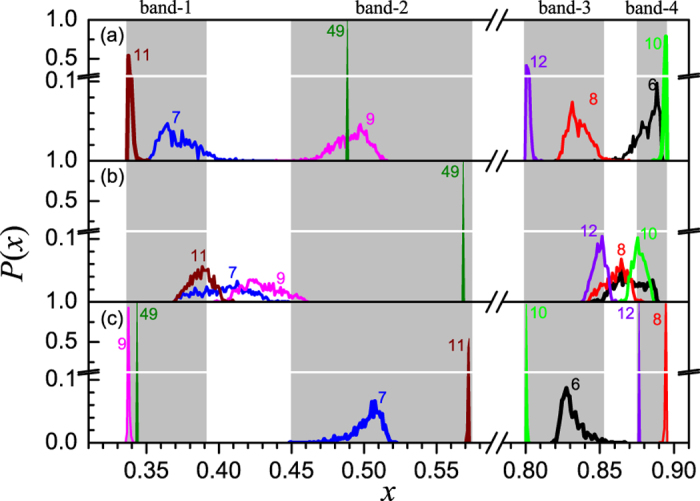
Figure 7. The distribution of node states for a typical initial condition when μ = 3.58.

In (a–c) the coupling strengths are ε = 0.45, 0.50 and 0.60, respectively. Gray background represents the chaotic bands of the logistic map.

In (a–c) the coupling strengths are ε = 0.45, 0.50 and 0.60, respectively. Gray background represents the chaotic bands of the logistic map.