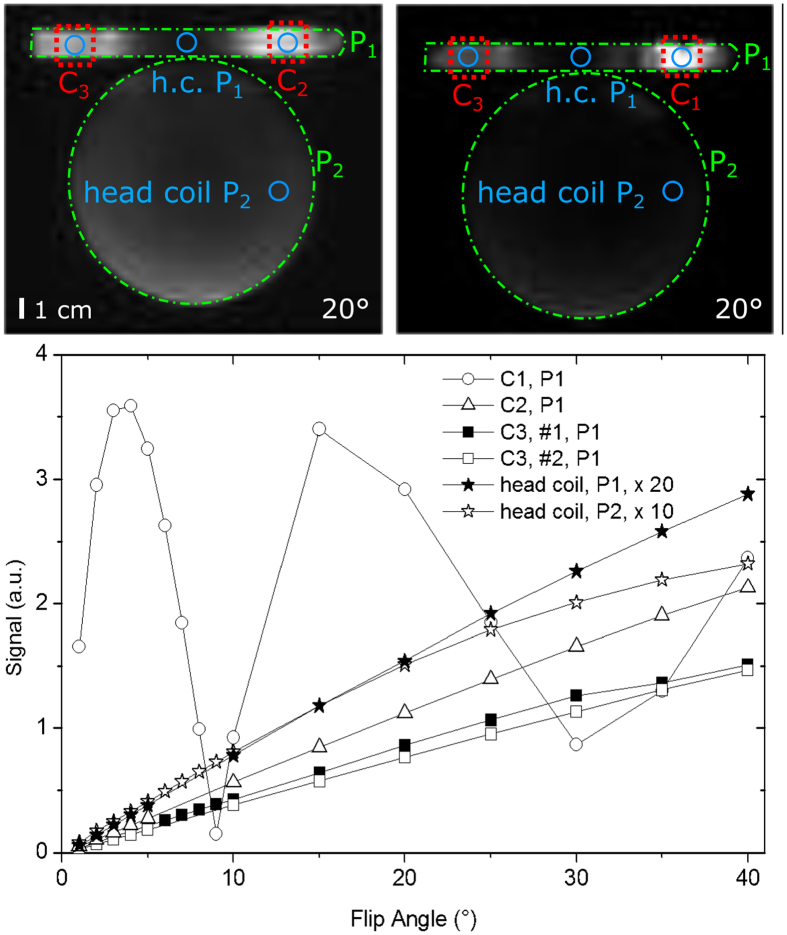
Figure 3. Single slice of a 3D 1H-FLASH MRI (top).
The intraoral coils (C1, C2, C3), the phantoms (P1, P2) and the regions-of-interest (ROI) are indicated by dotted red, dotted-dashed green and solid blue lines, respectively. The signal intensities of the ROIs was measured and plotted as function of the flip angle (bottom). The signals from the decoupled coils C2, C3 (triangles and squares) exhibited a similar response like the signal from the head coil (stars), indicating an effective decoupling. Note that C3 was used twice, and that the head-coil-only signals from P1 and P2 were multiplied by a factor of 20 and 10 for better visualization, respectively.

